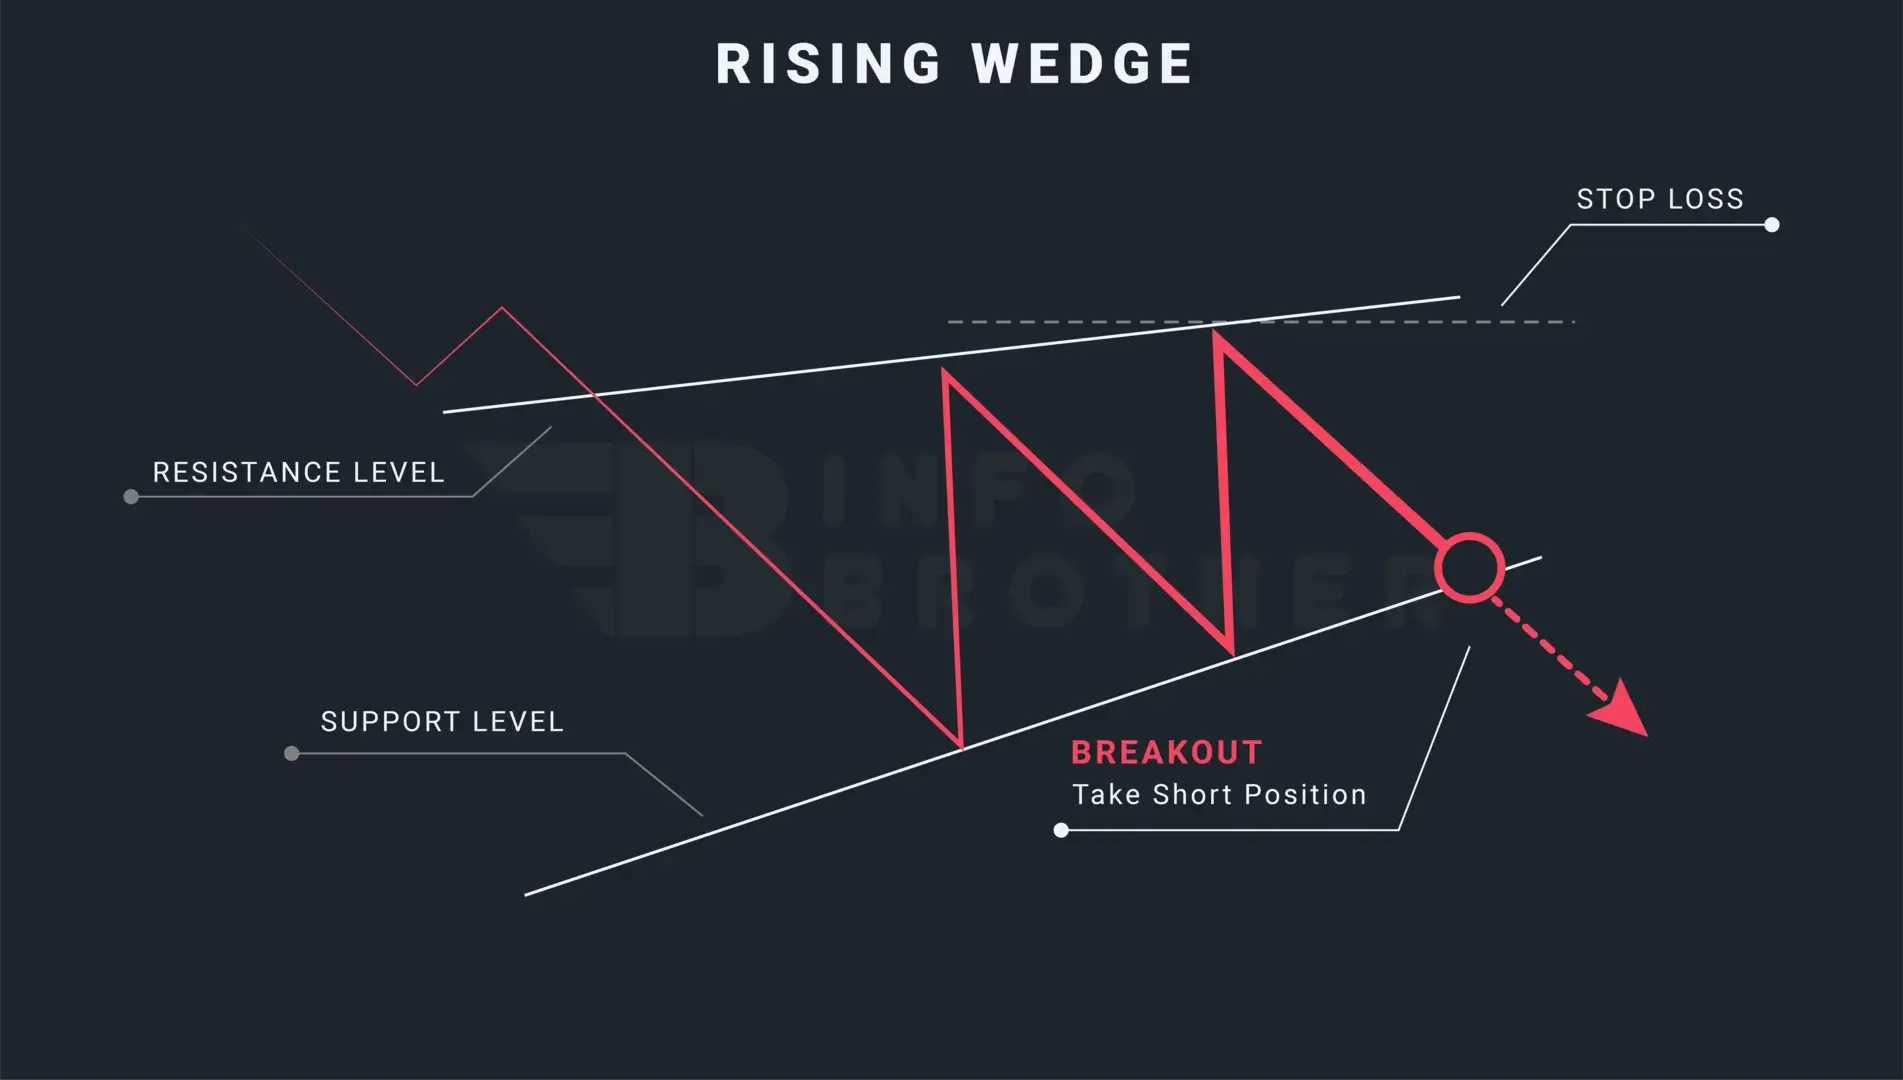
The rising wedge, also known as the ascending wedge, is a bearish continuation pattern that resembles a wedge because it begins broad at the top and narrows as prices decrease. In contrast to symmetrical triangles, which have no slope, price action generates an upward-sloping cone with higher highs and higher lows.
The rising wedge pattern will develop prior to the price action correcting upward, while the price is moving in a wide negative trend. Within this consolidation period, two converging trend lines that function as both support and resistance are formed. The consolidation phase ends when the price breaks through the bottom line or support level.
The volume, which declines as the channel converges, is one of the most fundamental elements of the rising wedge pattern. Following the consolidation of momentum within the channel, the sellers are able to tilt the scales in their favour and force the price action lower.
Rising Wedge Pattern in a Uptrend:
If the rising wedge pattern appears in an upward trend, it will be classified as a reversal pattern. When the price creates two contracting lines with higher highs and higher lows, this pattern occurs. If a rising wedge is identified in an upwardly trending market, traders see this pattern as a bearish reversal signal and look for potential selling opportunities.
The rising wedge pattern can be difficult to identify since it is seen as both a bearish continuation and a bearish reversal pattern. Both cases involve a variety of market conditions that must be considered.
The direction of the market is what differentiates the continuation pattern from the reversal pattern. If the market is trending downhill, the rising wedge pattern will be considered a continuation pattern. If the market is heading higher, the rising wedge pattern will be considered a reversal pattern.
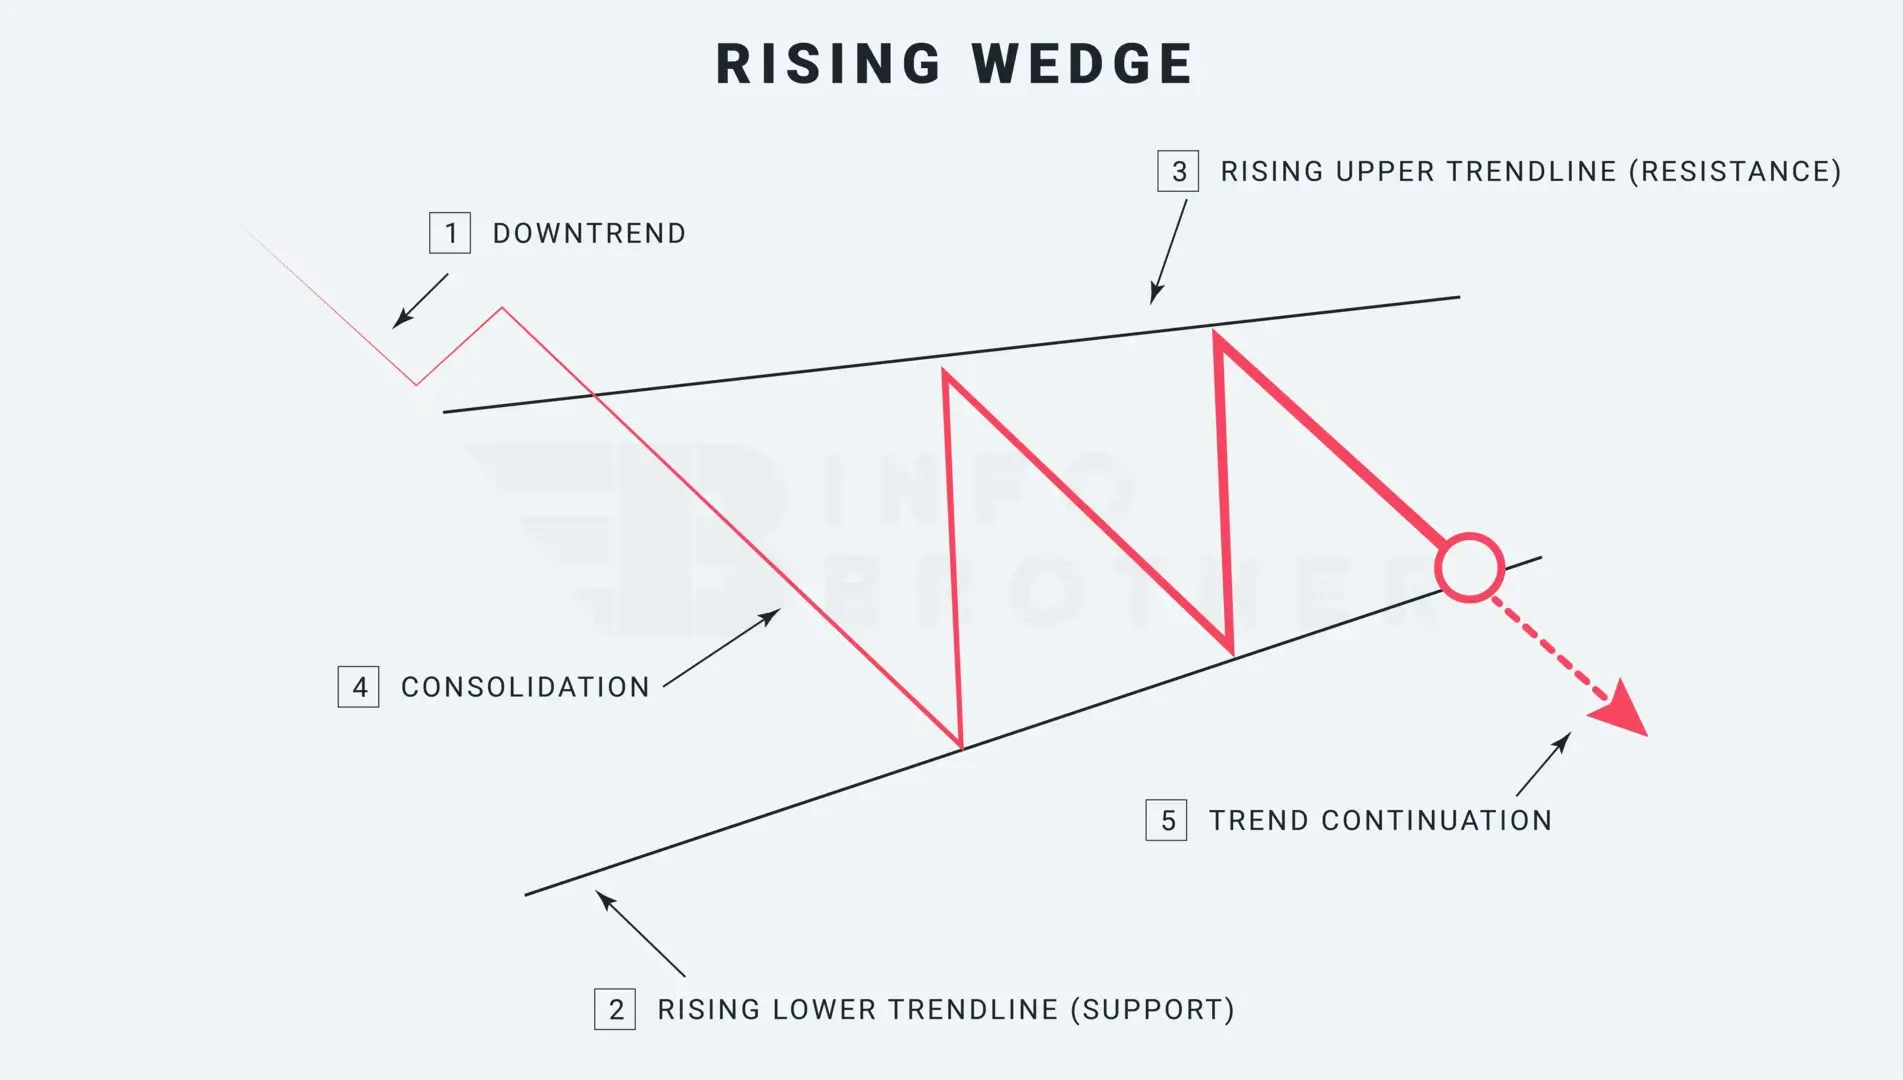
There are five elements to consider while determining the pattern.
1. A downward trend:
In order for a pattern to be seen as a continuation, the market must be declining. When the market is rising, the rising wedge is considered a bearish reversal indication.
2. Rising upper trendline:
Connect the higher highs to form a rising trendline or resistance level during the consolidation phase. Only in cases when there are at least two swing highs can the upper trendline be created. However, for a pattern to be considered a rising wedge, each high must be higher than the highs before it.
3. Rising lower trendline:
During the consolidation stage, join the lower lows to form a lower trendline or support level. At least two swing lows may be used to create the lower trendline. For the pattern to be considered a rising wedge, each low must be higher than the one before it.
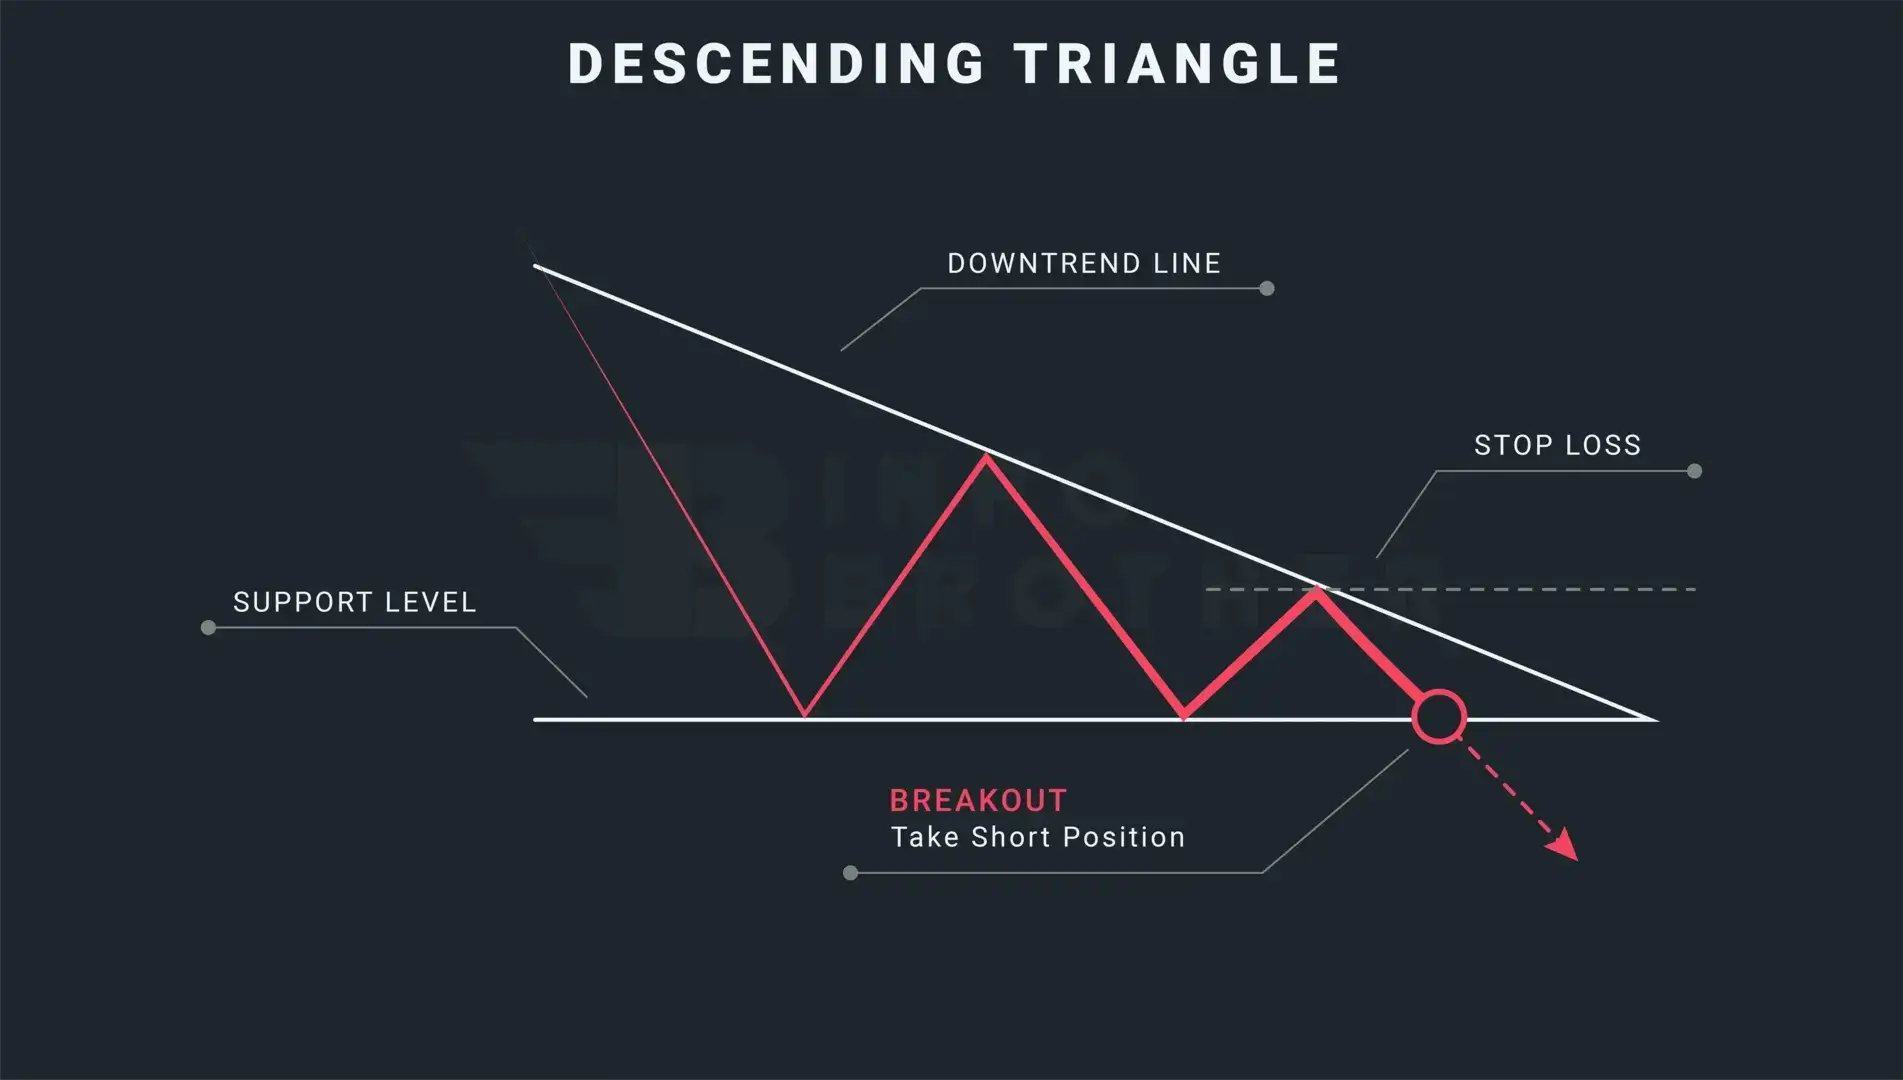
The Difference Between Rising Wedge and descending Triangle:
The descending triangle is a bearish continuation pattern that often arises during a downtrend. This pattern is formed by a horizontal line along the swing lows and a falling trendline along the swing highs...
Read More
As we are aware, the rising wedge pattern may be both a bearish continuation pattern and a bearish reversal pattern, depending on the state of the market. However, both situations may allow for the adoption of the same trading strategies. When a rising wedge satisfies all the criteria, attention must be paid to the crucial elements of a trade, such as the entry position, stop loss, and take profit.
Here are some common methods to use when trading a wedge pattern.
- Recognize the rising wedge chart pattern. Draw trendlines along the swing highs and swing lows to highlight the pattern.
- Pay attention to the breakouts. This suggests that the price is breaking from the established wedge pattern.
- Open a short trade when the price breaks below the support level and the breakout is confirmed.
- We might place the stop-loss just above the upper trendline, on the other side of the wedge's breakout.
- The take-profit goal may be the height of the wedge at its thickest point.
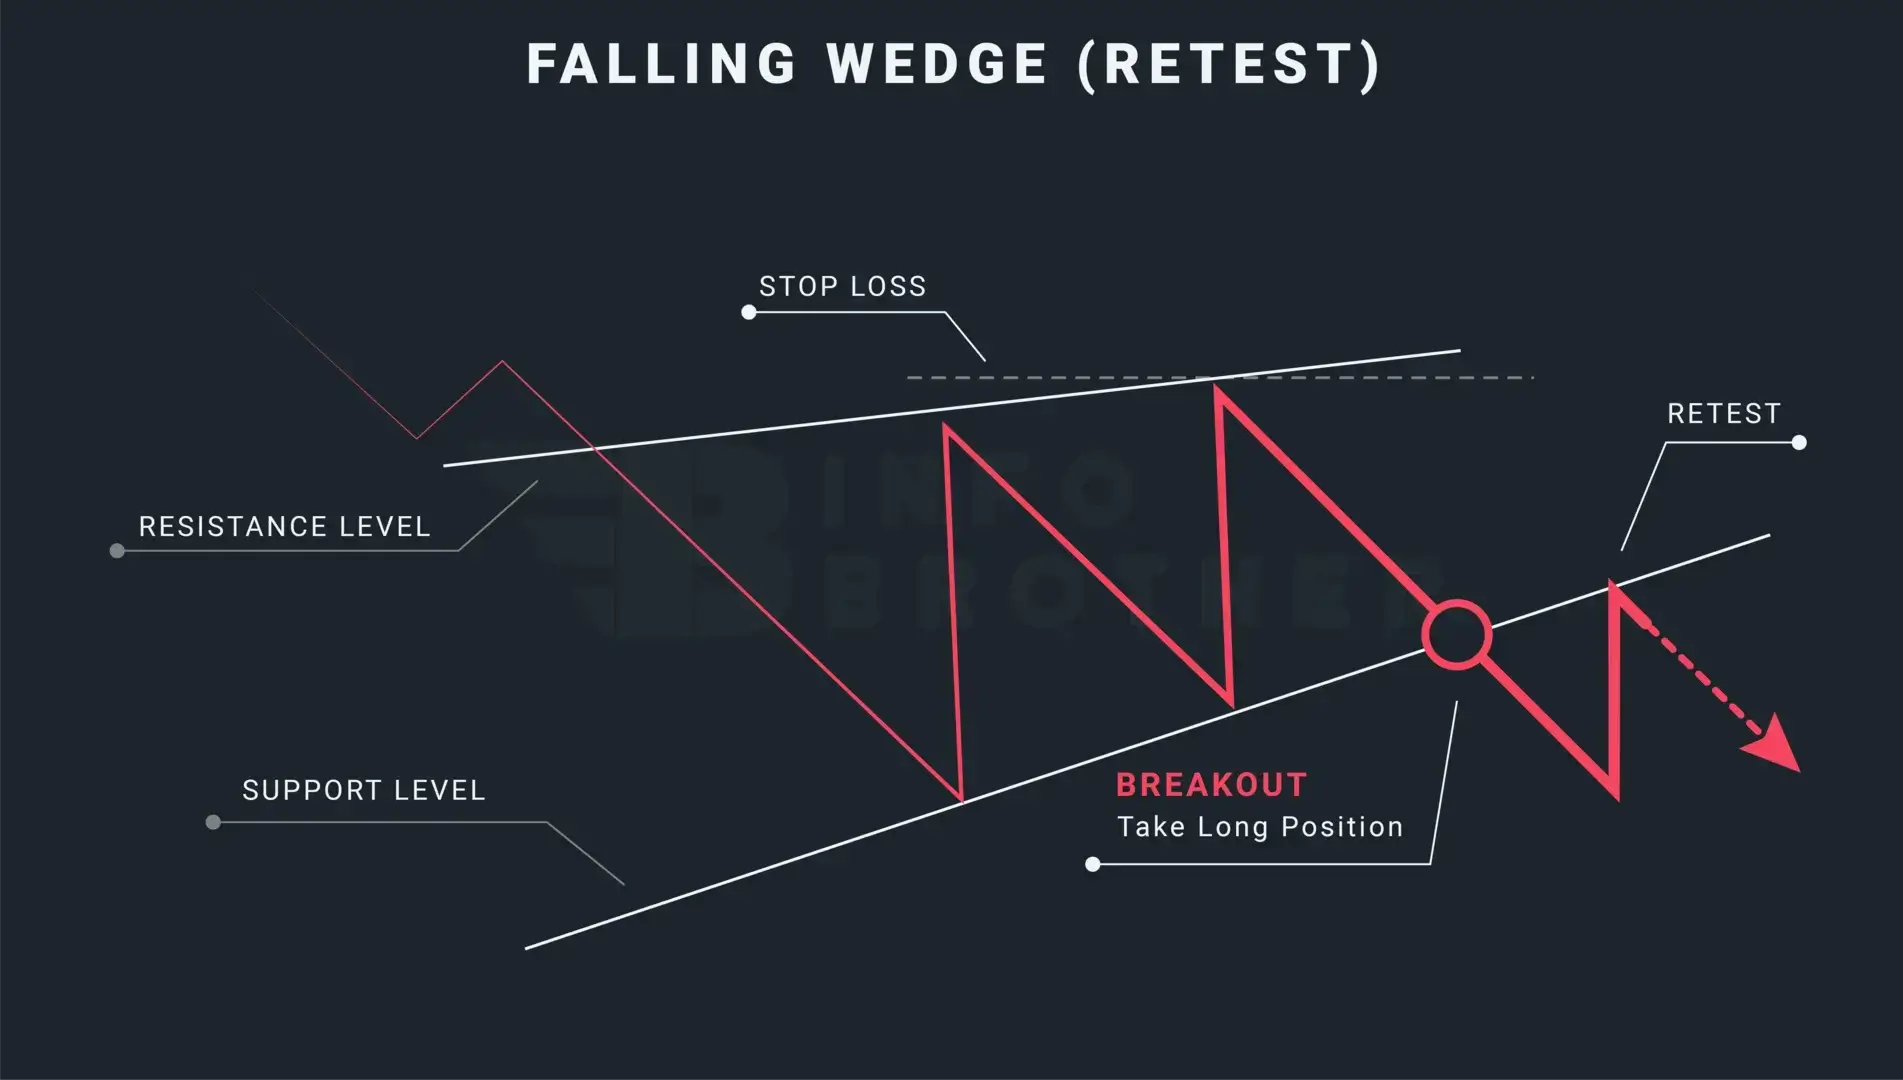
Retesting is the act of bringing a price back to a level that the market has previously breached. A retest, which happens when the price breaks through the trendline and returns to retest the resistance or support level that was just crossed, may be used by traders to prevent false breakouts.
