Inverse head and shoulder patterns, commonly referred to as 'head and shoulder bottoms,' are bullish reversal patterns that show up during market declines. This pattern is similar to the standard head and shoulders pattern, but it is inverted, and it frequently signifies a shift in trend and market attitude.
The inverse head and shoulders pattern is one of the most prominent bullish reversal indicator patterns, and it is related to a price reversal from a declining trend. This pattern has three sequential troughs, the centre one being the deepest and known as the head, and the outside two being the shoulders. The shoulders should have an identical height and width on both sides.
Theory:
According to the theory underlying this pattern, prices rise from the first low with rising volume until a point when the left shoulder formation is complete, after which they decline to the new low. The head formation is finished with a recovery motion that has a little bit more volume than what was previously seen. A corrective reaction on low volume causes the right shoulder to begin to develop, and then a sharp move up on greater volume once more breaches the neckline.
After a downturn, an inverse head and shoulders pattern, also known as the head and shoulder bottom, develops, signalling a change in trend. The following attributes are required for the inverse head and shoulder formation: The price drops to a trough known as the left shoulder, rises, drops again below the former trough known as the head, rises once more, and ultimately drops again to the next trough known as the right shoulder, but not as far as the second trough or the head. After the last dip is formed, the price moves higher toward the resistance located close to the top of the earlier troughs.
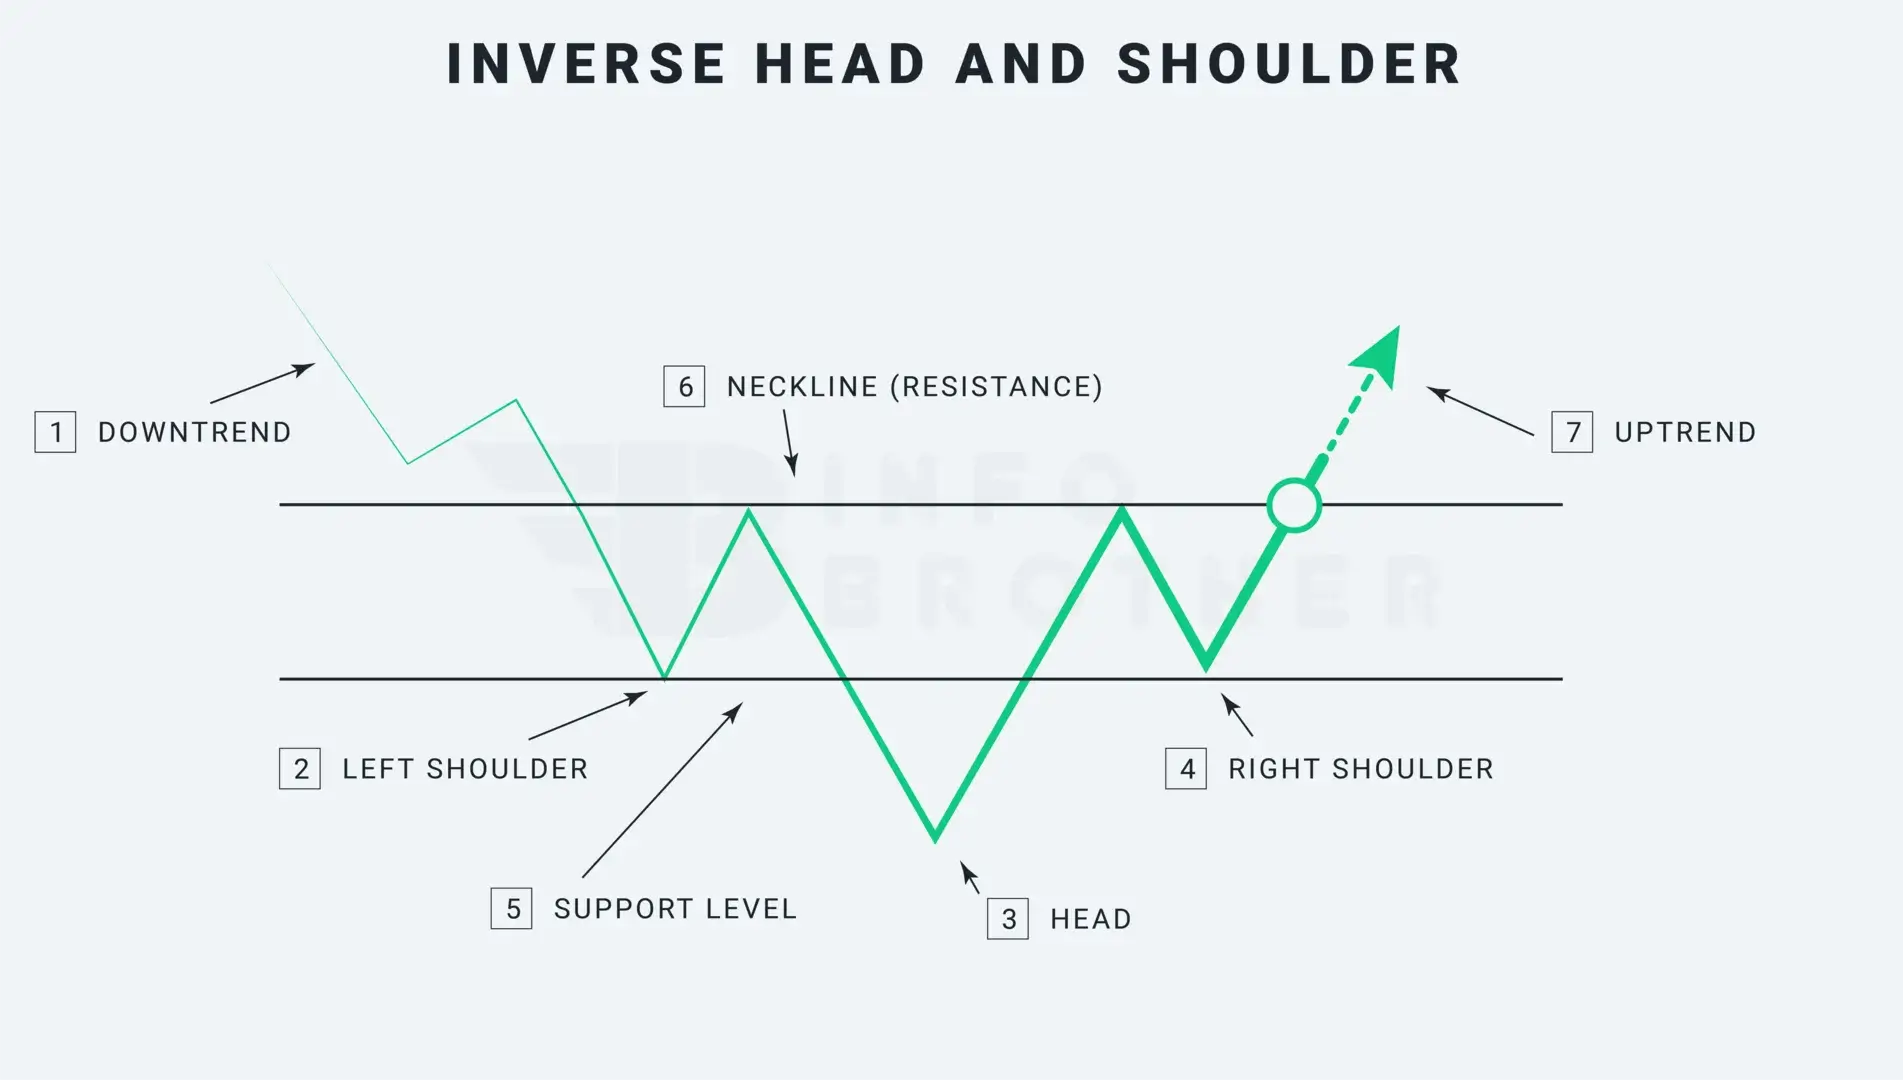
There are seven factors to consider while determining the inverse head and shoulder pattern.
1. A Downward trend:
An inverse head and shoulder pattern is a reversal pattern, and reversal patterns can only happen when there is already a trend. A significant downward turn should be present in the case of an inverse head and shoulder pattern.
2. Left Shoulder:
In a market with a downward trend, the left shoulder creates a trough that represents a new bottom for the trend. Prices rise to finish the development of the left shoulder once this trough is formed.
3. Head
A drop that goes beyond the previous low and creates the new low point of the head starts at the high of the left shoulder. In order to complete the head formation, the price rises once more after reaching the bottom and moves toward the prior resistance level, or neckline.
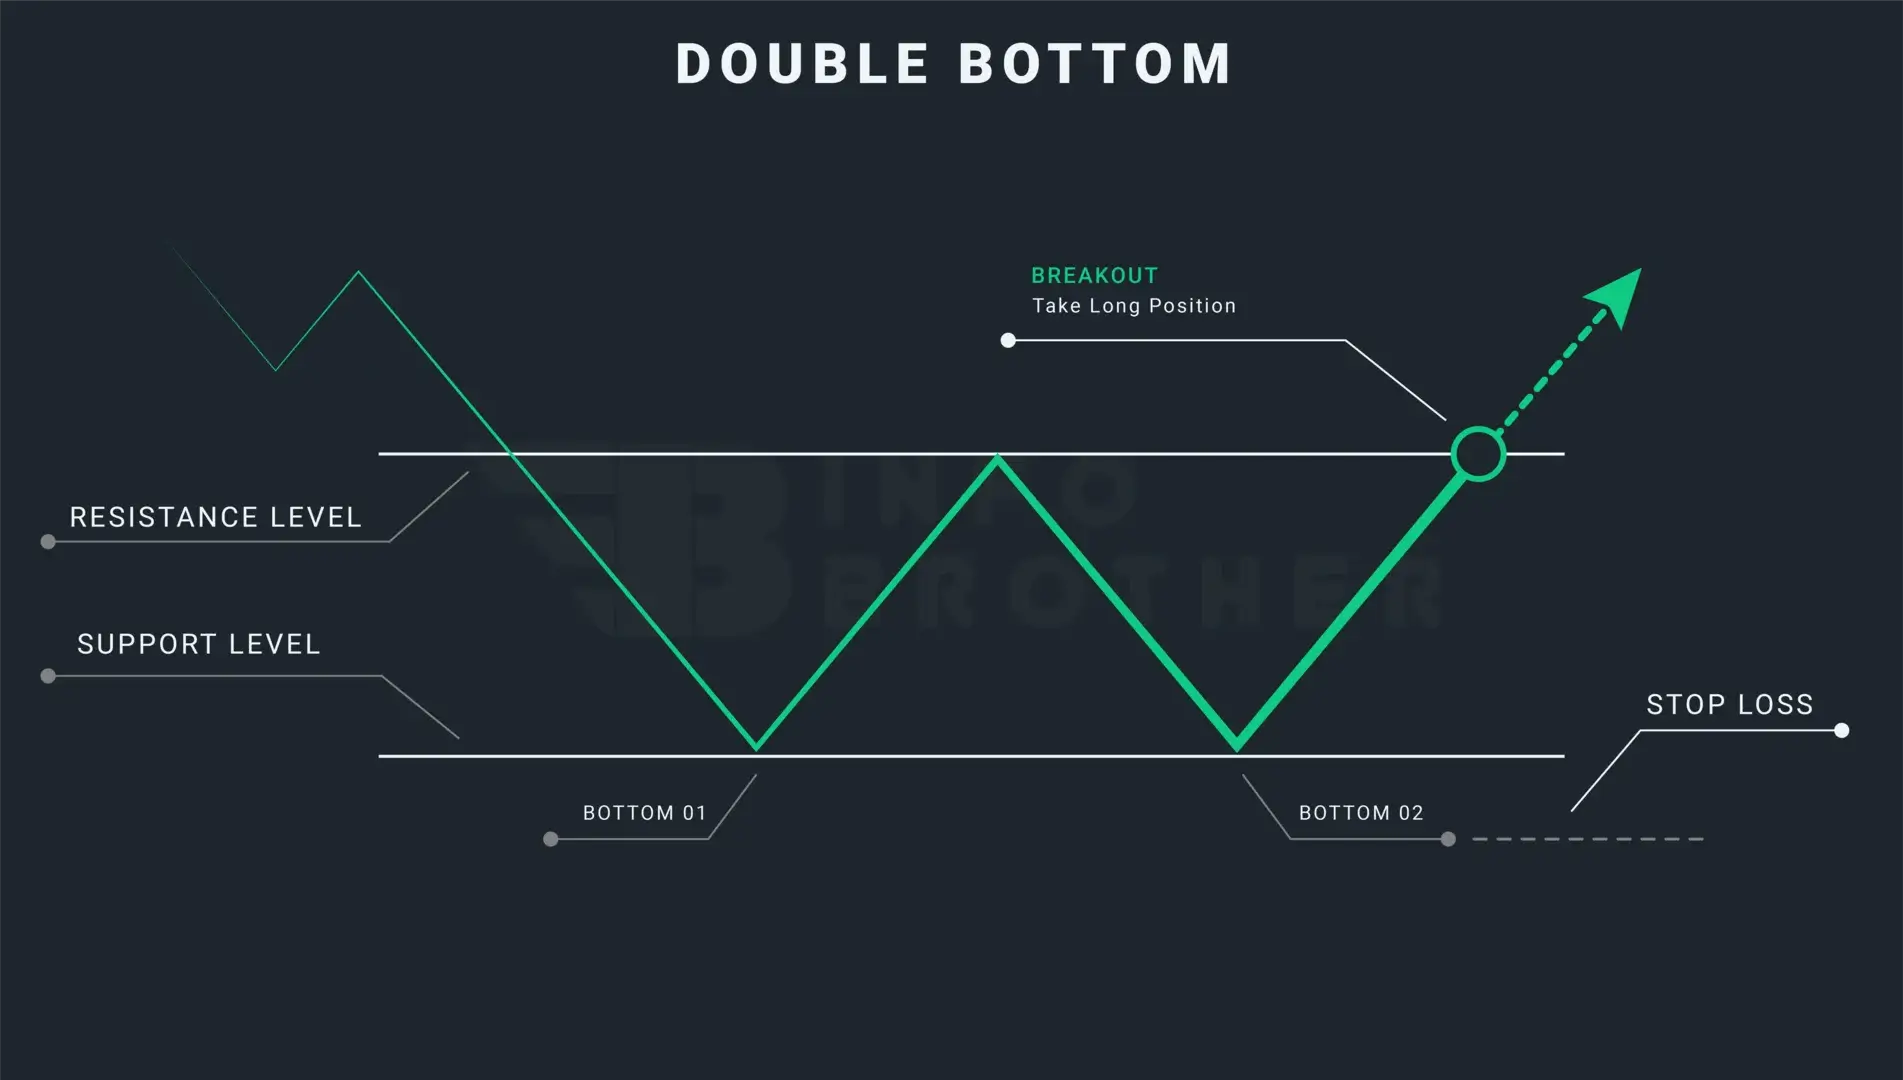
The Difference Between inverse head and shoulder and double bottom:
At the bottom of a downtrend, a bullish reversal pattern known as the double bottom pattern can be seen. This pattern resembles the letter 'W' because it twice touched the low, which we see as a support level...
Read More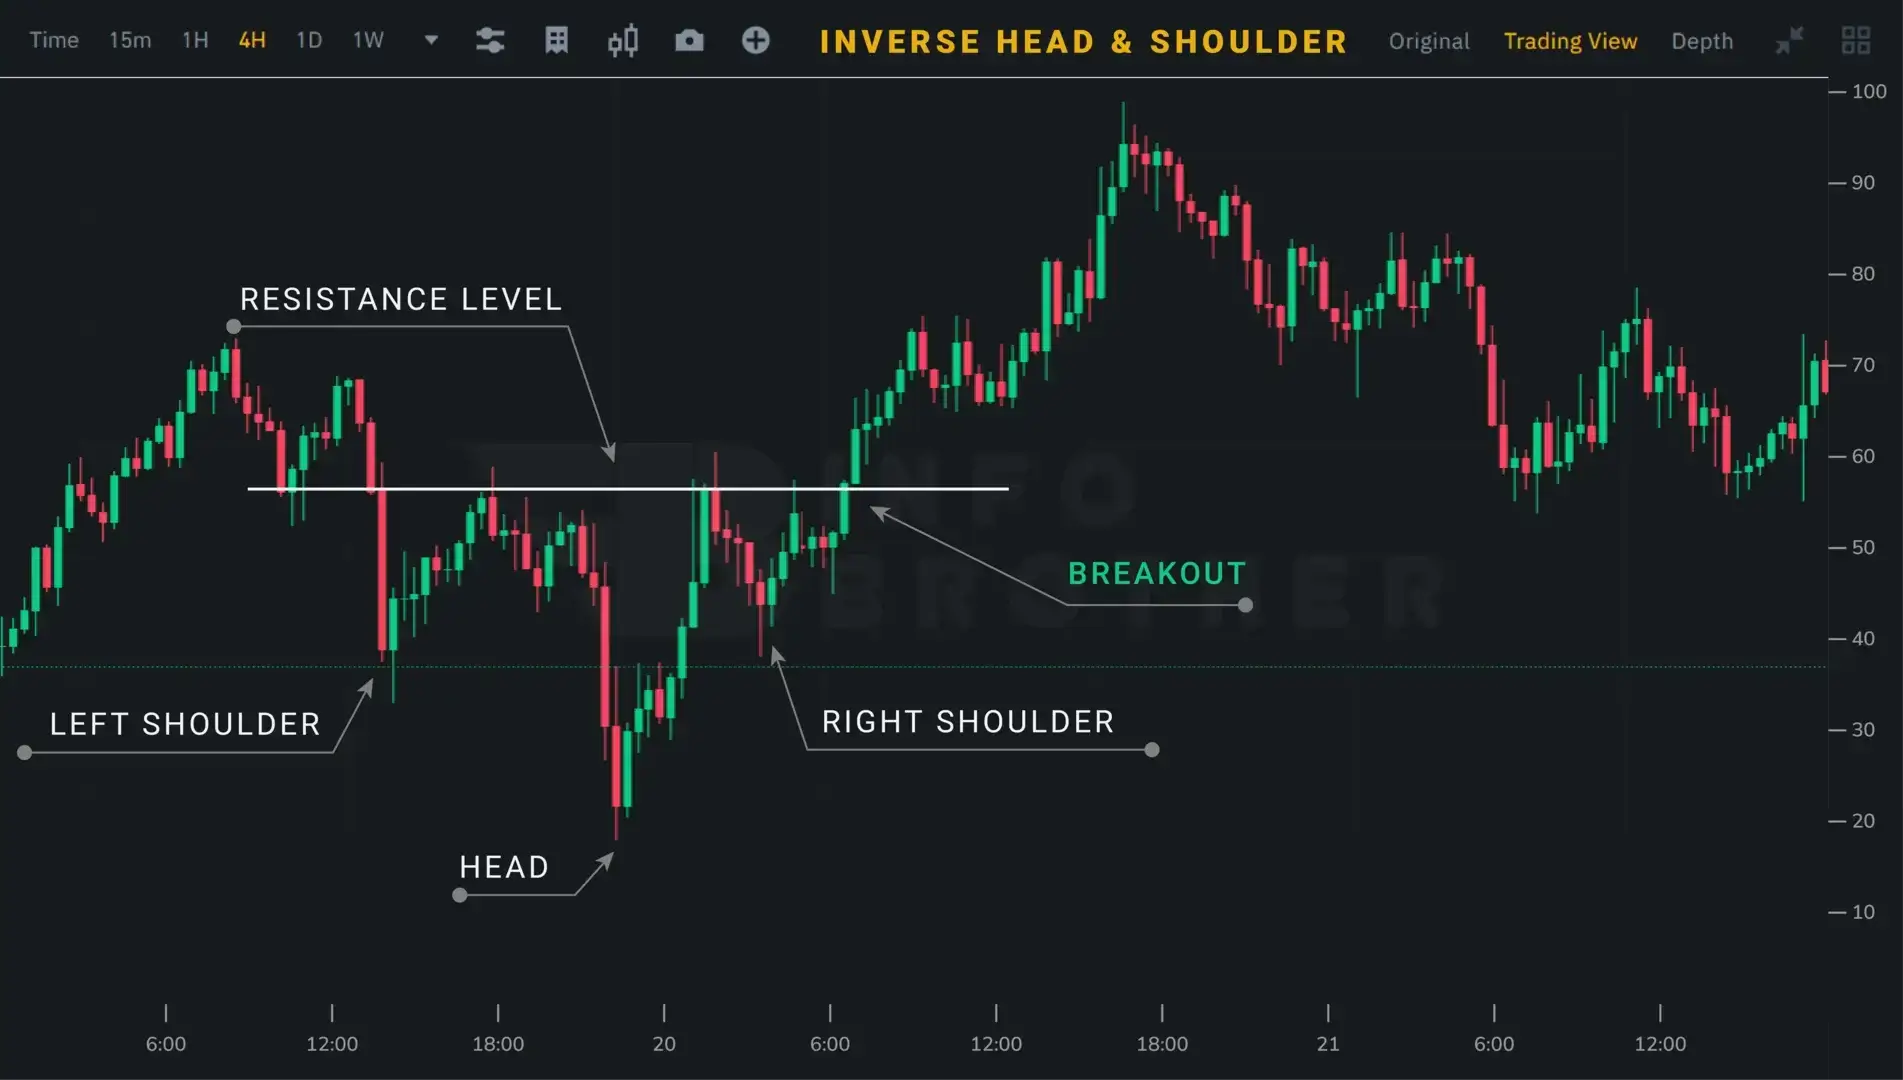
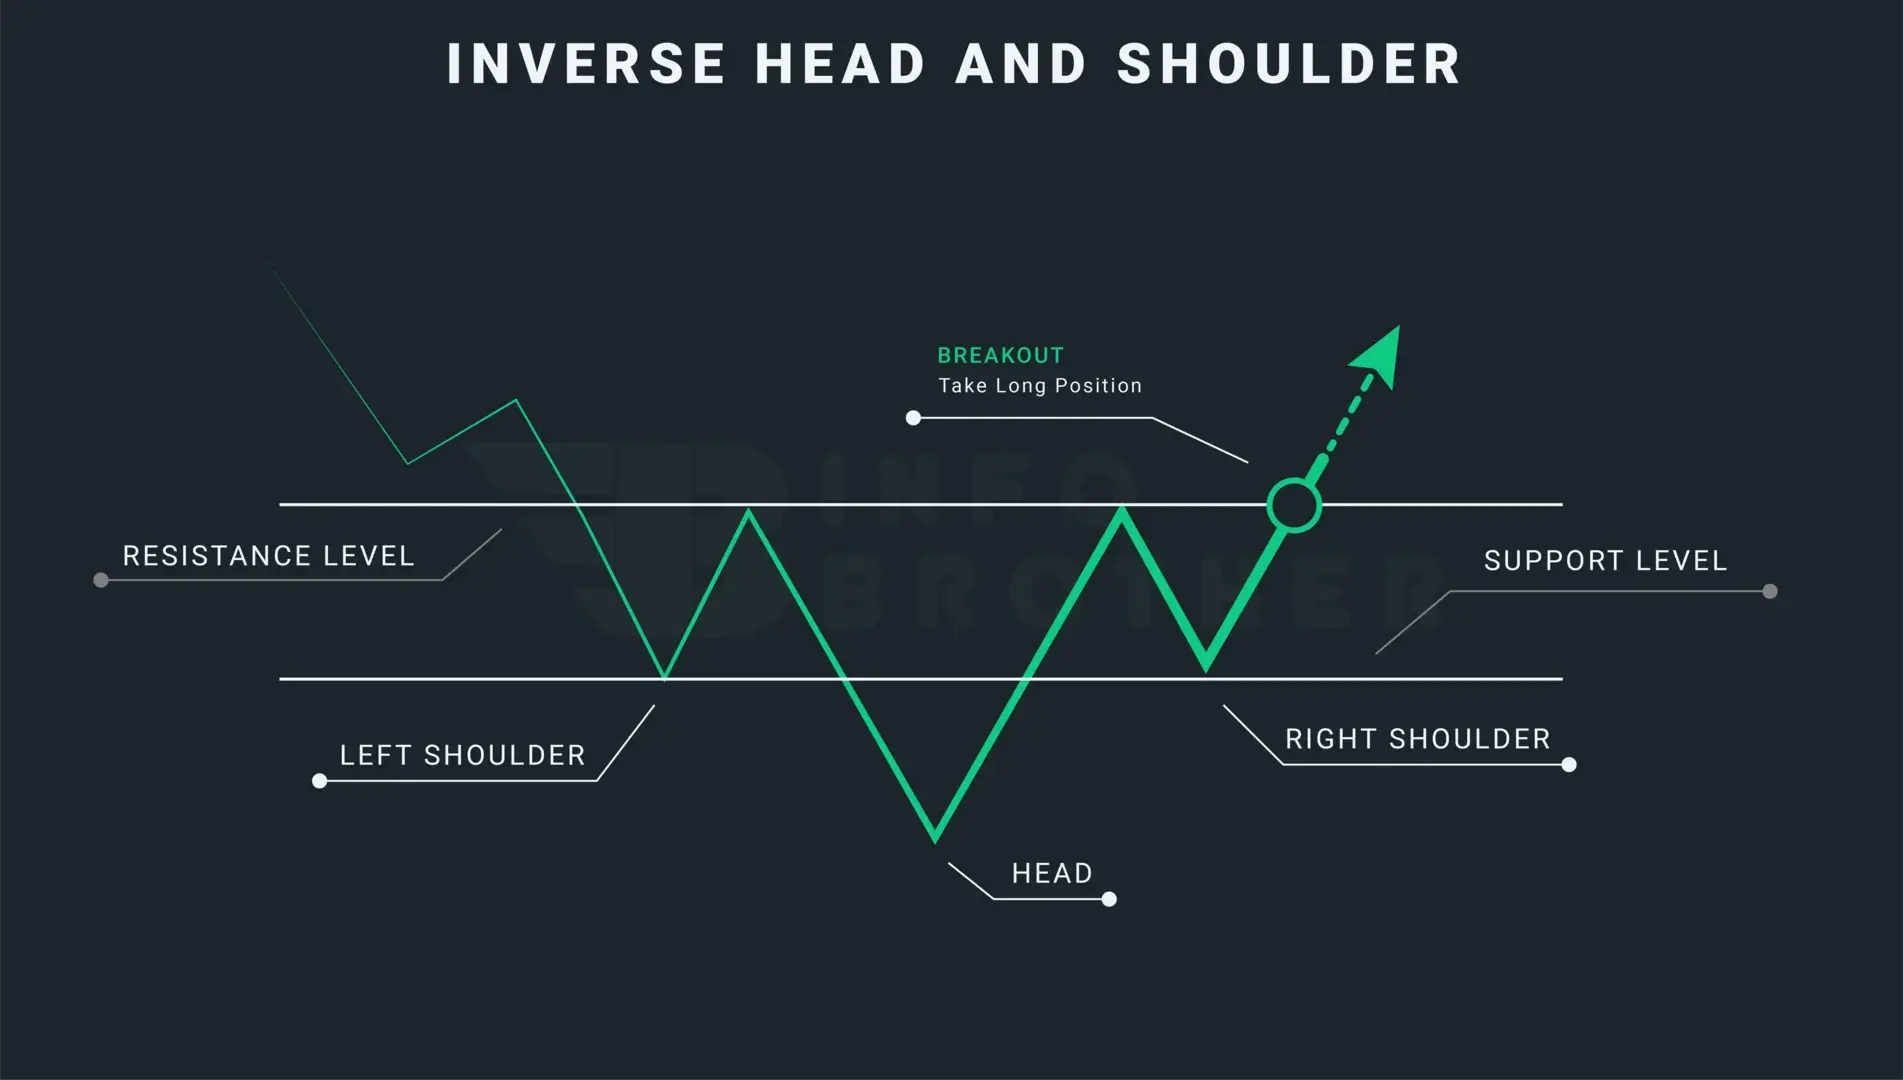
In a downward trend, the inverse head and shoulders pattern forms, signalling a change in sentiment from bearish to bullish. When a price trough is reached, it rises briefly before falling again—this time more sharply—before rising once more and dropping once more for the final time.
When prices start to climb once again and break the neckline or resistance level, traders enter into a long position. Successful traders seek a large candle in volume to establish the accuracy of the breakthrough.
- A stop-loss order might be set right below the broken neckline or level of resistance.
- By calculating the distance between the pattern's neckline and the bottom of the head, the profet target may be set by positioning the target at that same distance from the neckline in the breakout direction.
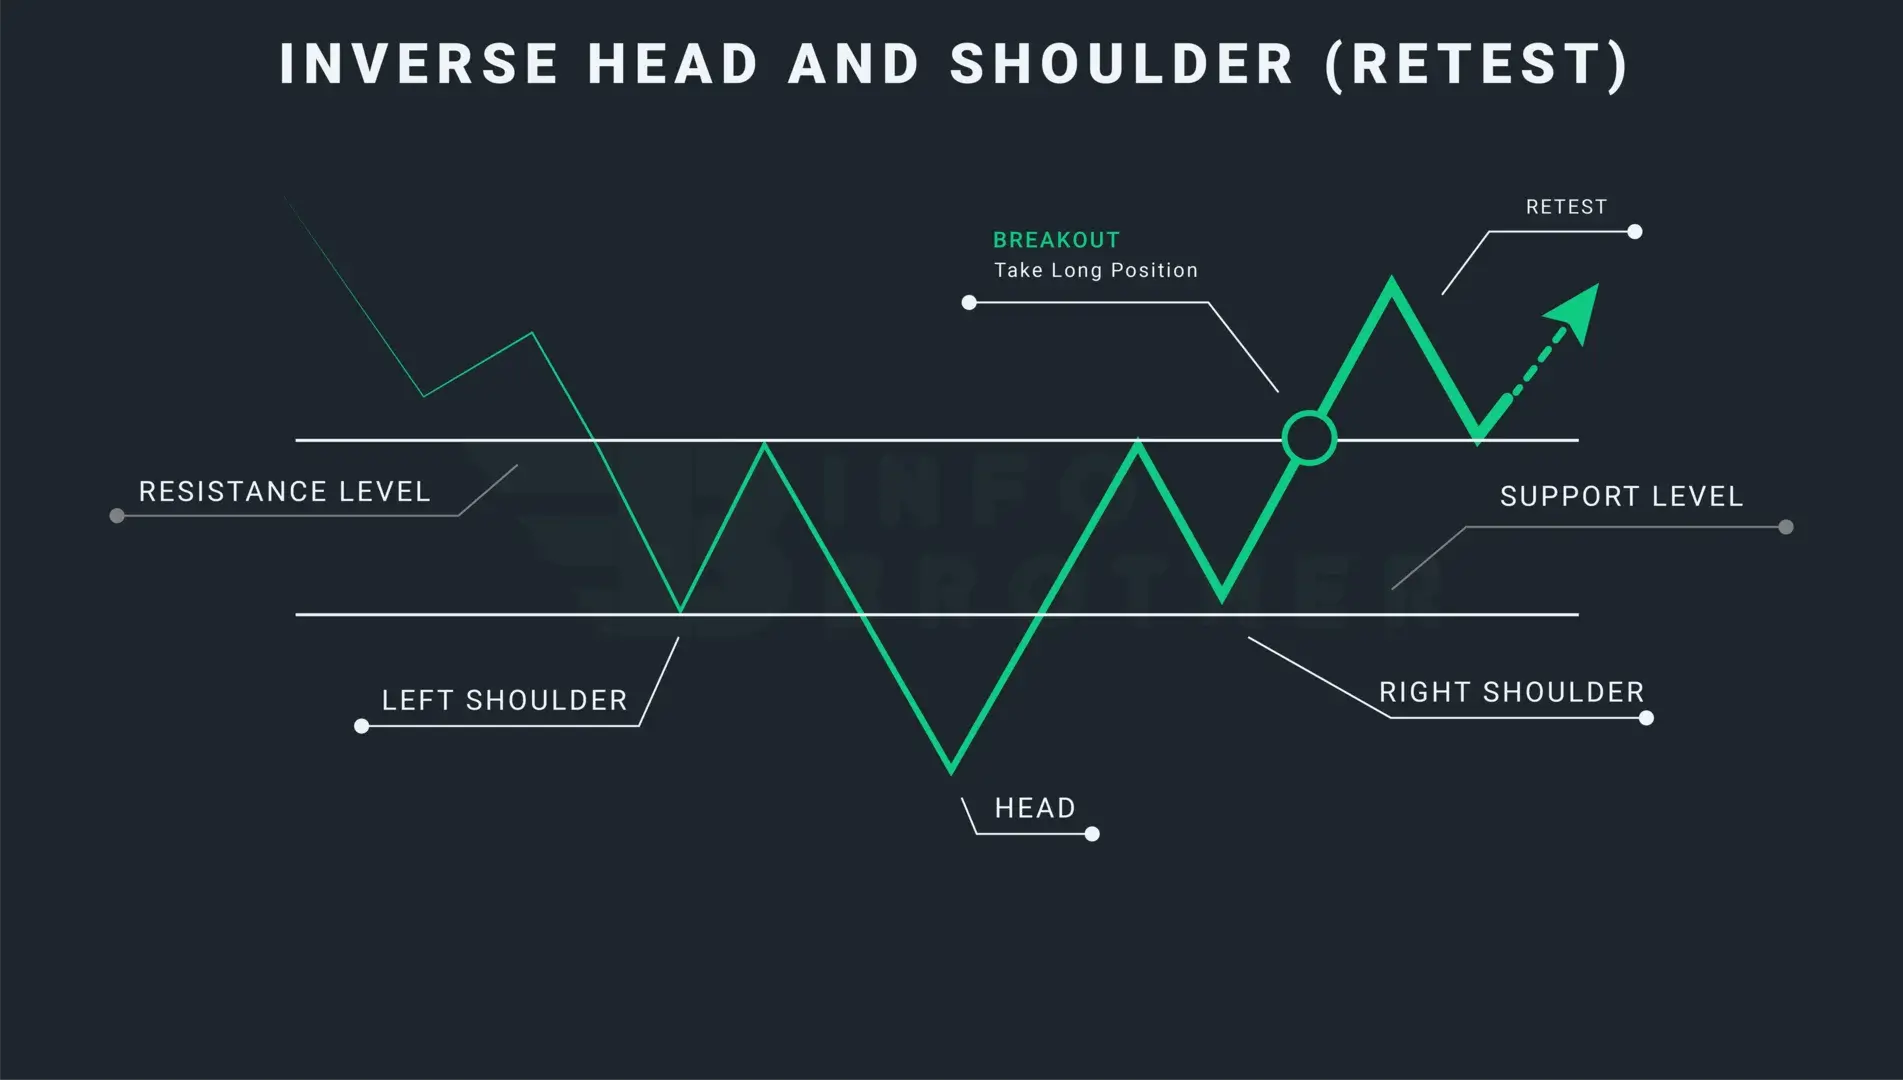
Bringing a price back to a level that the market has already crossed over is known as retesting. Traders may employ a retest to stop false breakouts. A retest occurs when the price crosses the trendline and then reverses direction to retest the resistance or support level that was just crossed.
