A bearish flag is a continuation pattern that appears in markets with significant downward trends and alerts traders to the likelihood of more declines in the trend. We called this arrangement a 'bearish flag' since it resembles a flag on a pole. The flag denotes a time of consolidation, but the pole denotes a dramatic vertical decline in the market. The flag can have a horizontal rectangular shape, but it can also have an angle-up shape that goes against the current trend.
The bears' flag patterns are appropriate for the current cryptocurrency market conditions because of the significant trends that seasoned investors may profit from. This pattern is effective for both swing trading and day trading. Trading with flag patterns is beneficial when the market has just broken out or is actively moving.
Most traders confuse flag patterns with pennant patterns. However, these two designs are diametrically opposed. The fundamental contrast between the flag pattern and the pennant pattern is the appearance of support and resistance levels inside the formations. Flag patterns are made up of two parallel lines, whereas pennant patterns are made up of support and resistance lines that converge on an apex.
The bear flag pattern is a chart pattern that indicates the continuation of a decline. Price movement consolidates inside two parallel lines in the opposite direction of the downward trend before breaking out and continuing the decline. If this pattern occurs during a downtrend, the trend has a 98% likelihood of continuing.
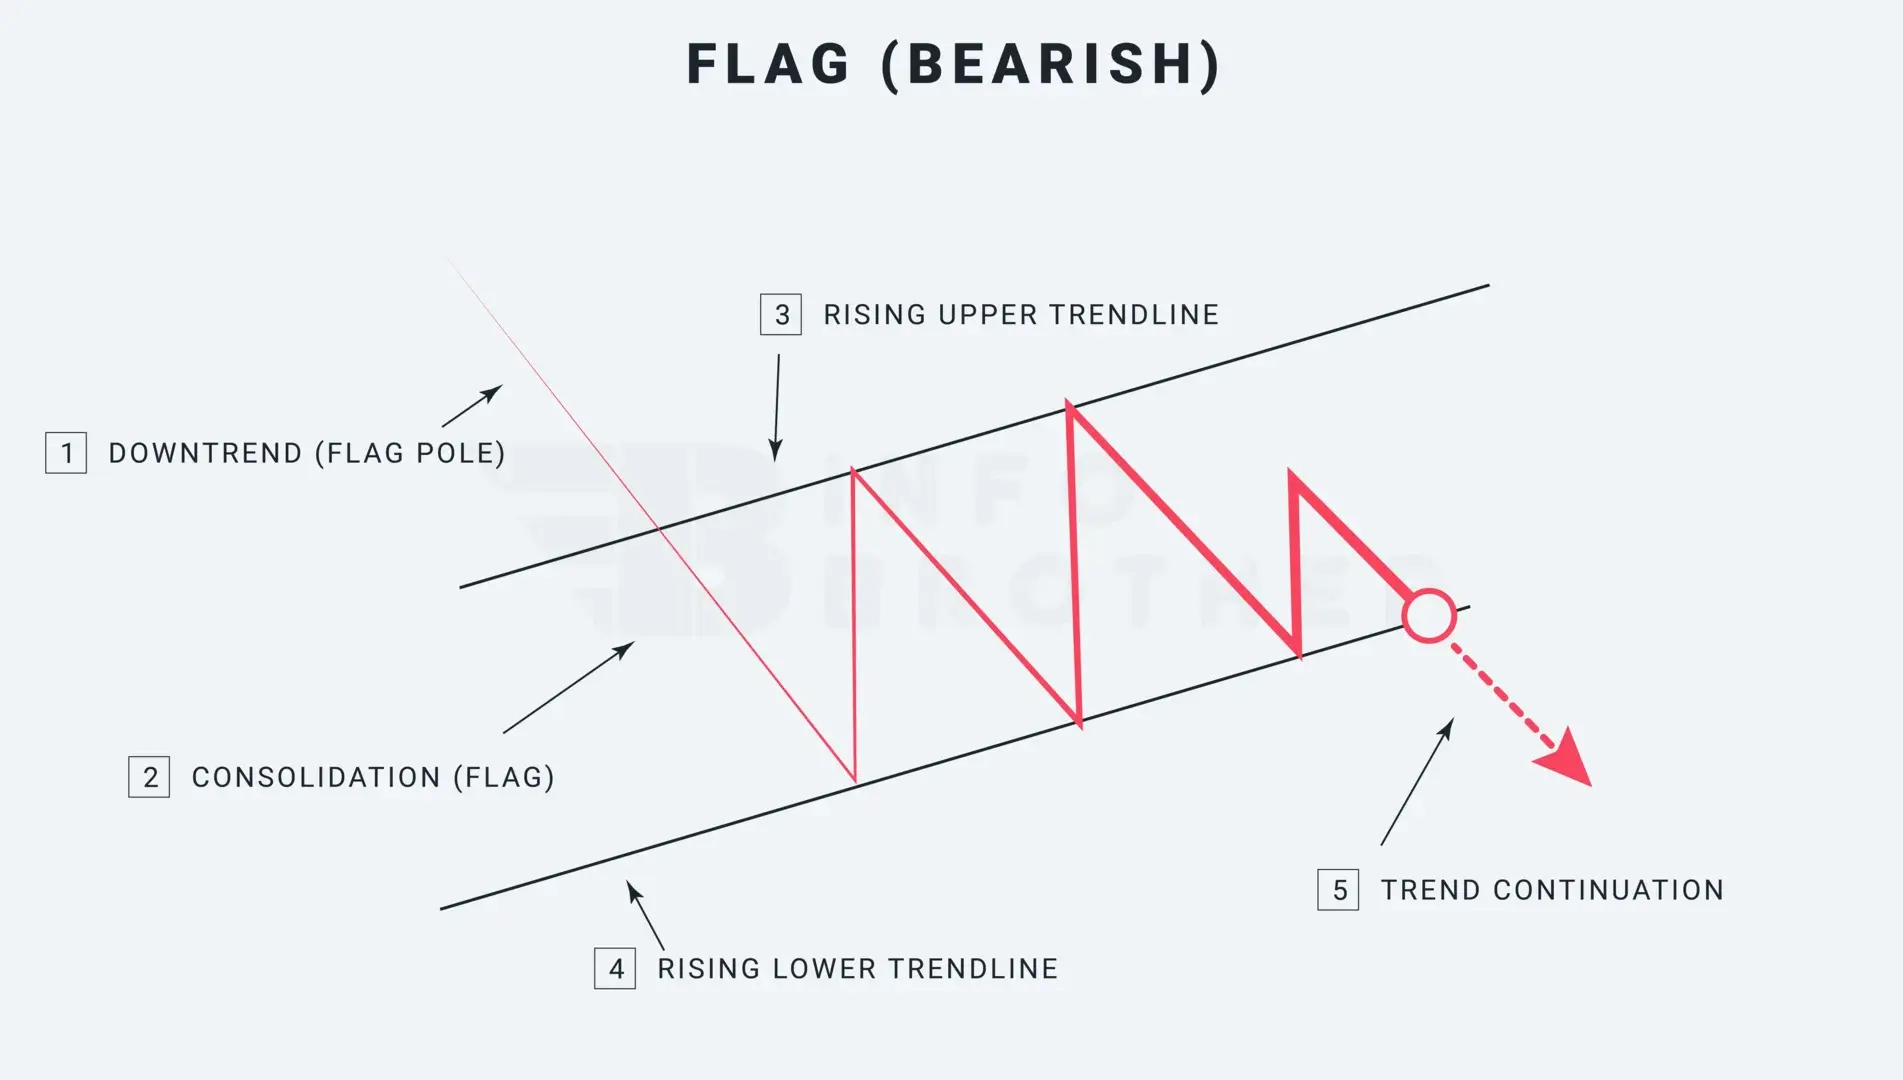
There are five factors to examine while determining a bearish flag pattern.
1. Downtrend (Flagpole)
The market must be in a downward trend prior to the development of the bearish flag pattern. Unlike other designs, such as the symmetrical triangle, this one always starts with a flagpole. If the trend is upward or sideways, traders should avoid this pattern.
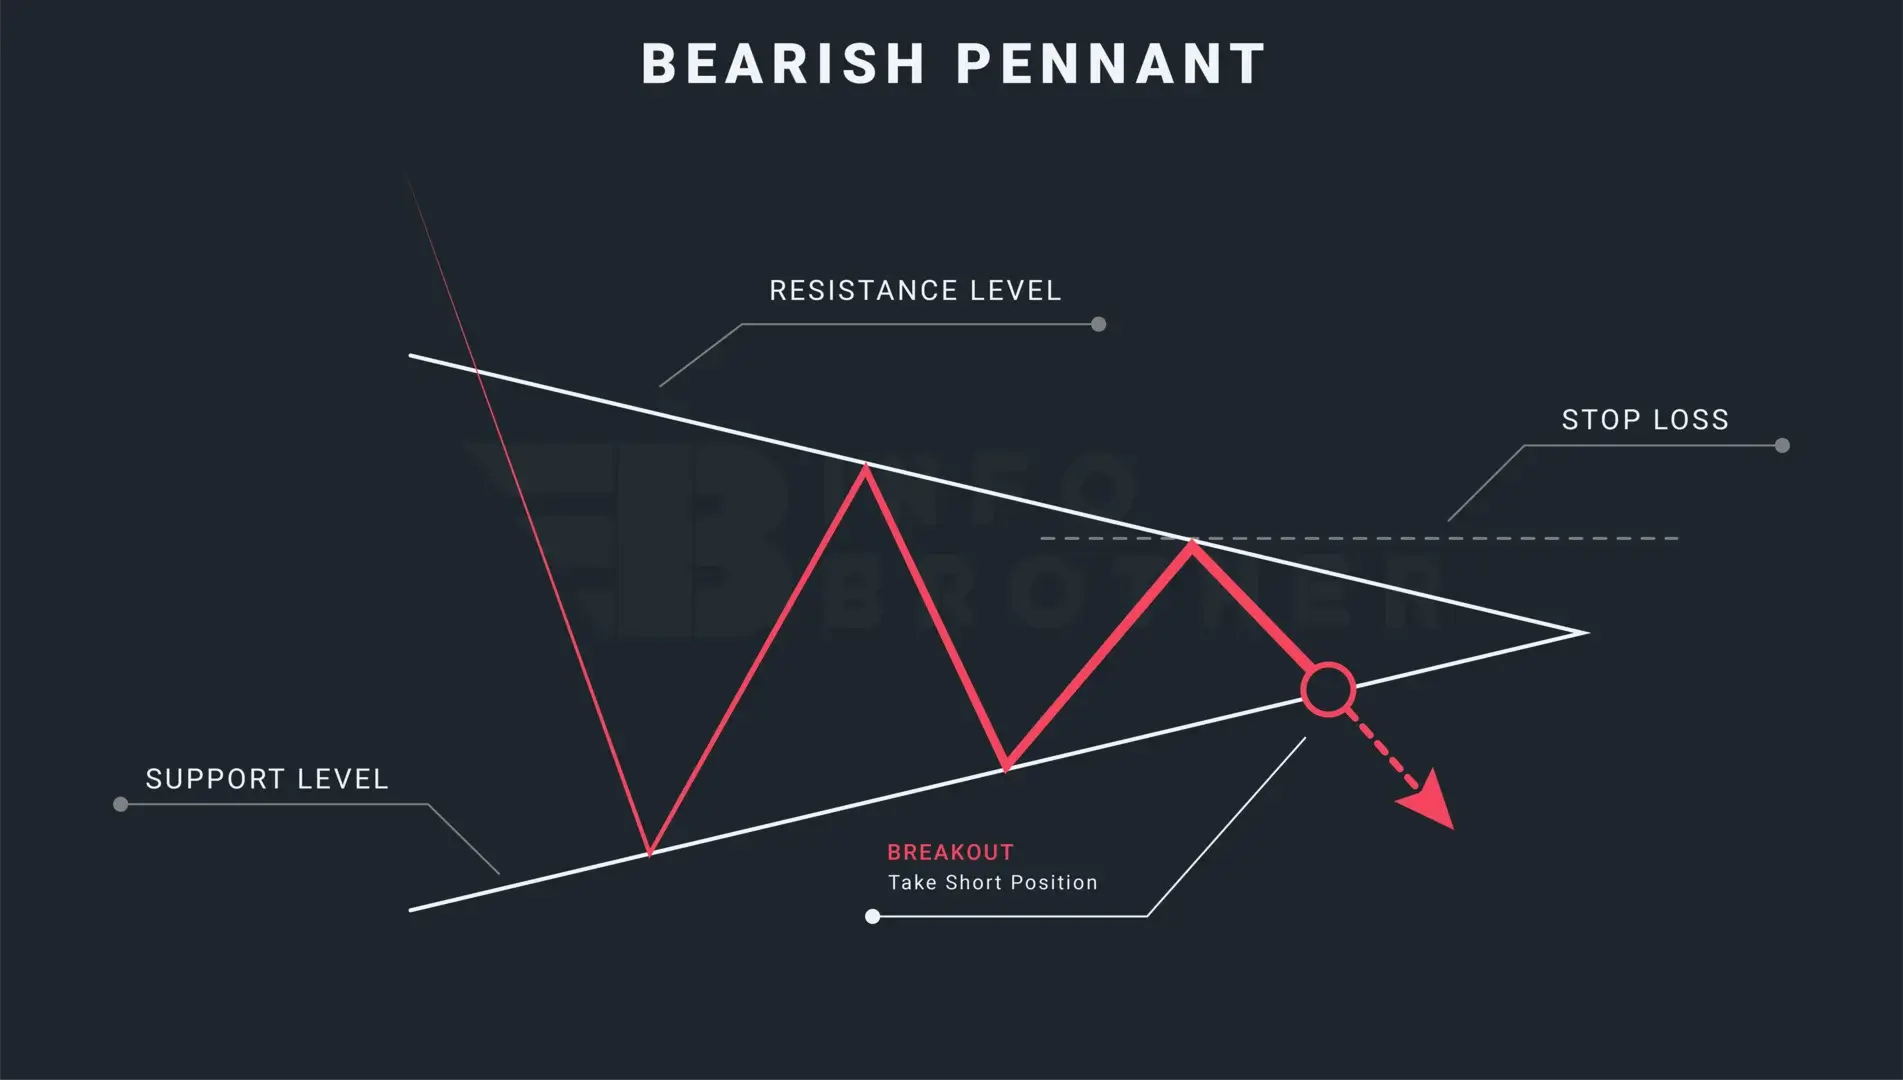
The Difference Between a Flag Pattern and a Pennant Pattern:
The look of the support and resistance levels inside the formations is the primary distinction between a flag pattern and a pennant pattern.
Read More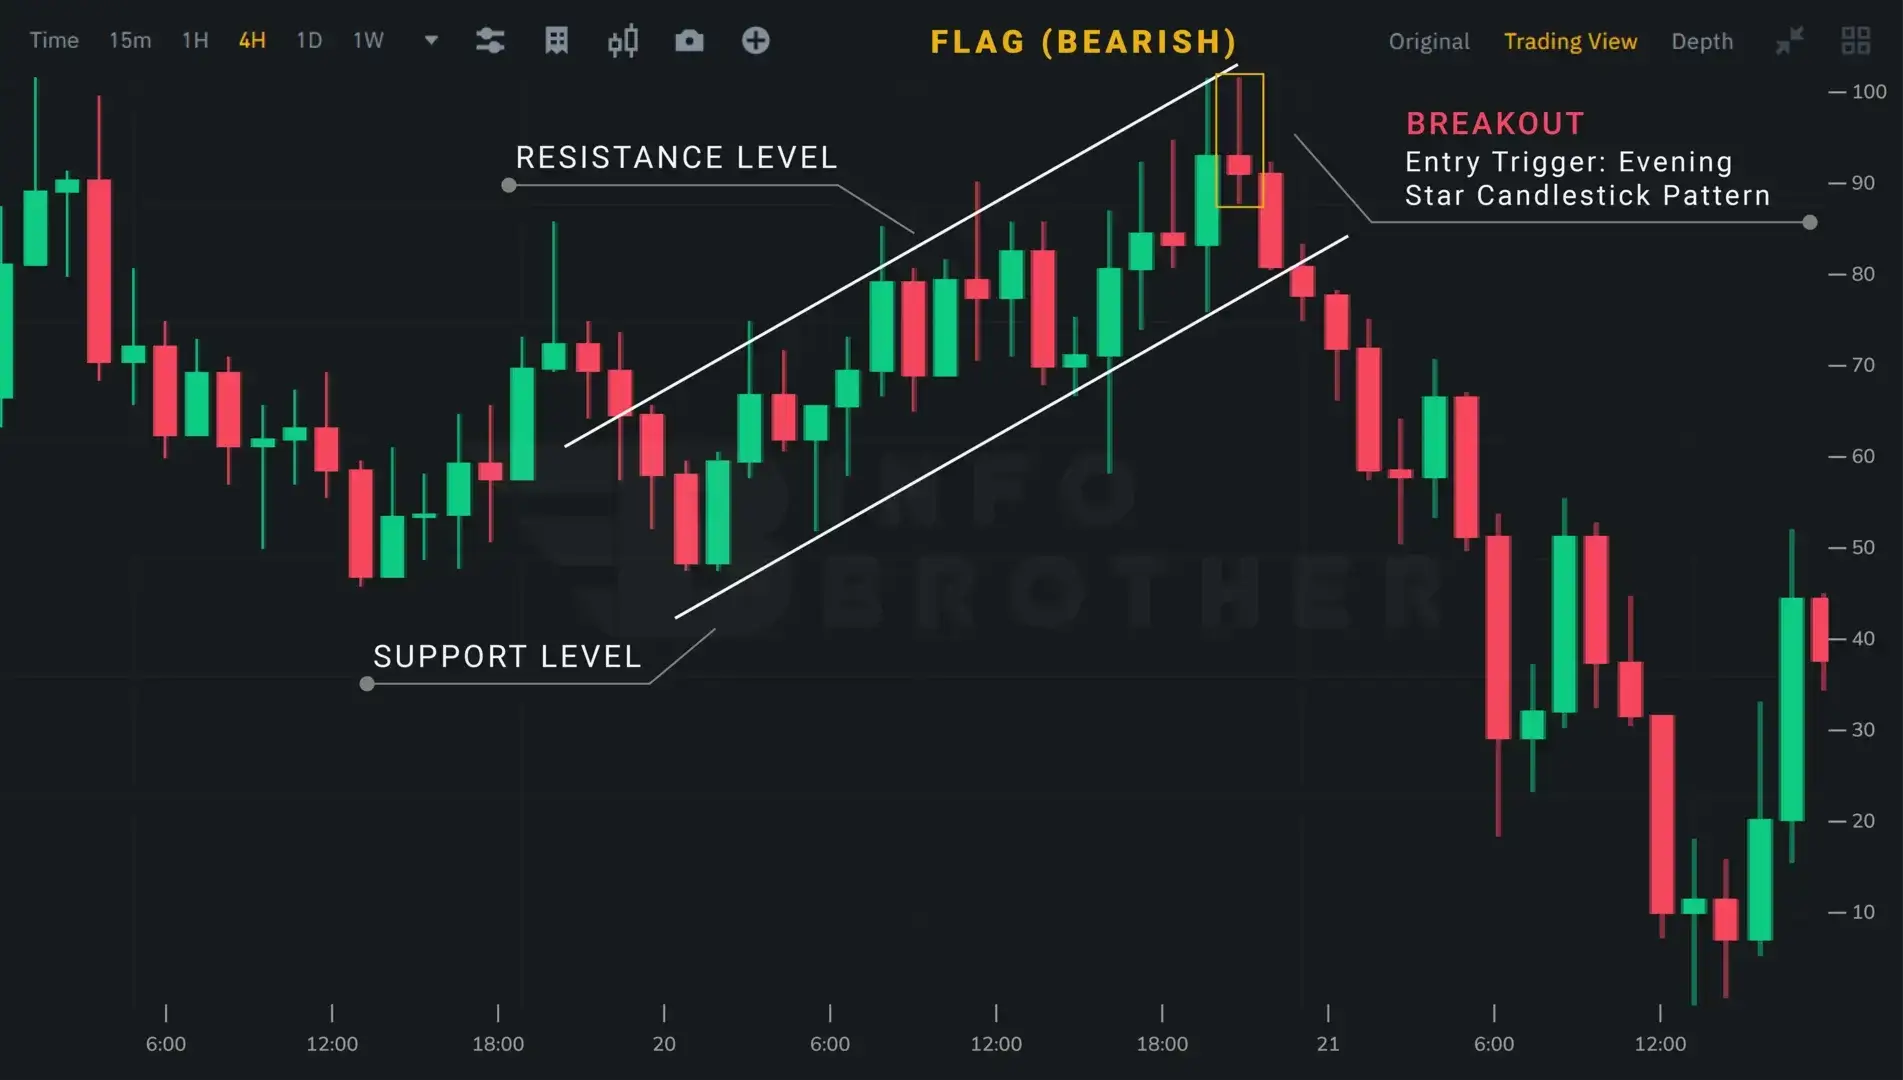
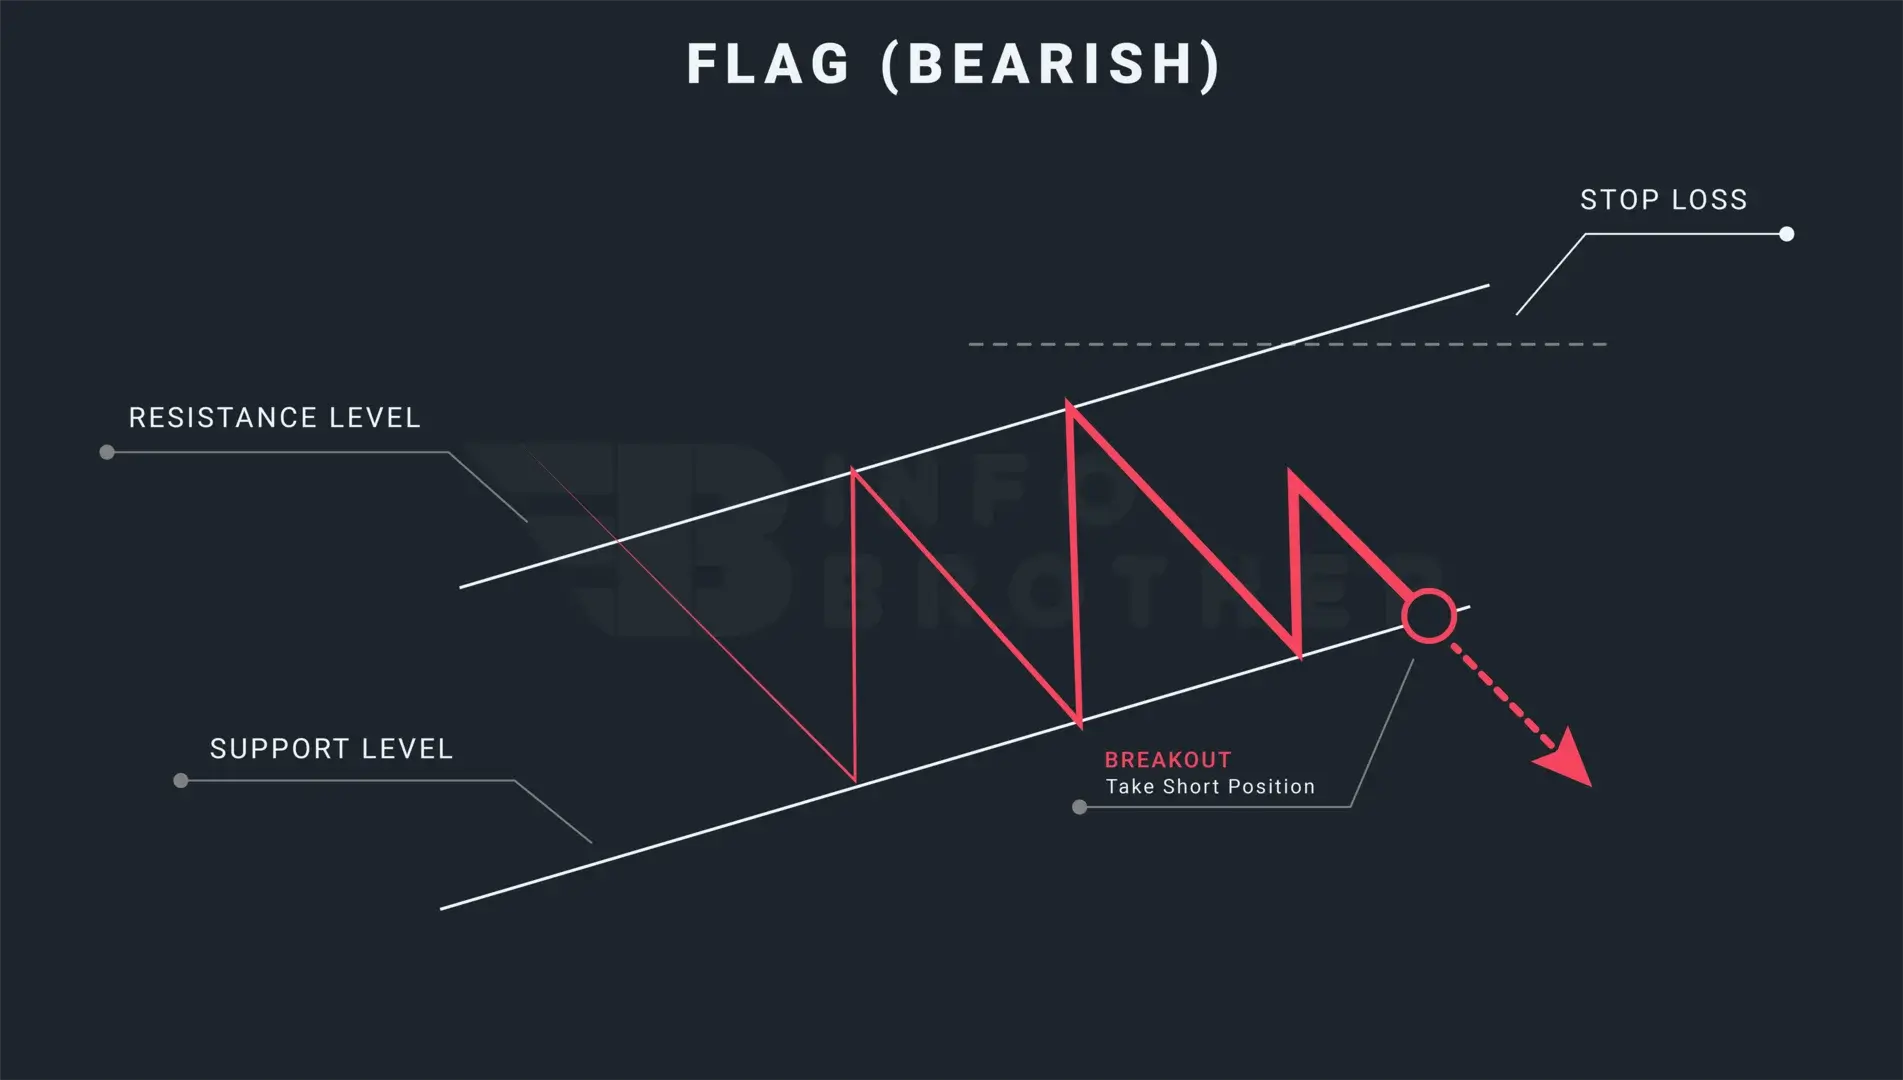
Trading the bear flag pattern is a straightforward operation if the previous step, recognizing and drawing the formation, is completed correctly. Downtrends are shaped and formed by the bear flag, which allows traders to pinpoint entry and limit levels.
Traders enter at the close of the breakout candle or wait for a retest, which can be challenging because the price movement may never return to retest the broken resistance.
Any movement to the interior body of the flag invalidates the pattern. In very volatile markets, we should follow the risk management rule and place the stop-loss precisely above the flag formation to avoid false breakouts and market whipping.
Traders just copy and paste the flagpole from the point when the breakout happened in the case of a take-profit. The end point of the prior trendline shows a place where we might consider taking profits. At this point, we can see that the market hit this level and then slightly corrected lower, suggesting that the bear flag's take profit order has been met.
Remember that market fluctuations aren't always predictable, so risk management methods should always be adopted before starting a trade. False breakouts may be a significant issue with these patterns. Price may deviate from the pattern only to re-enter it, or it may break out in the other direction. A trader can prevent this by waiting for the retest.
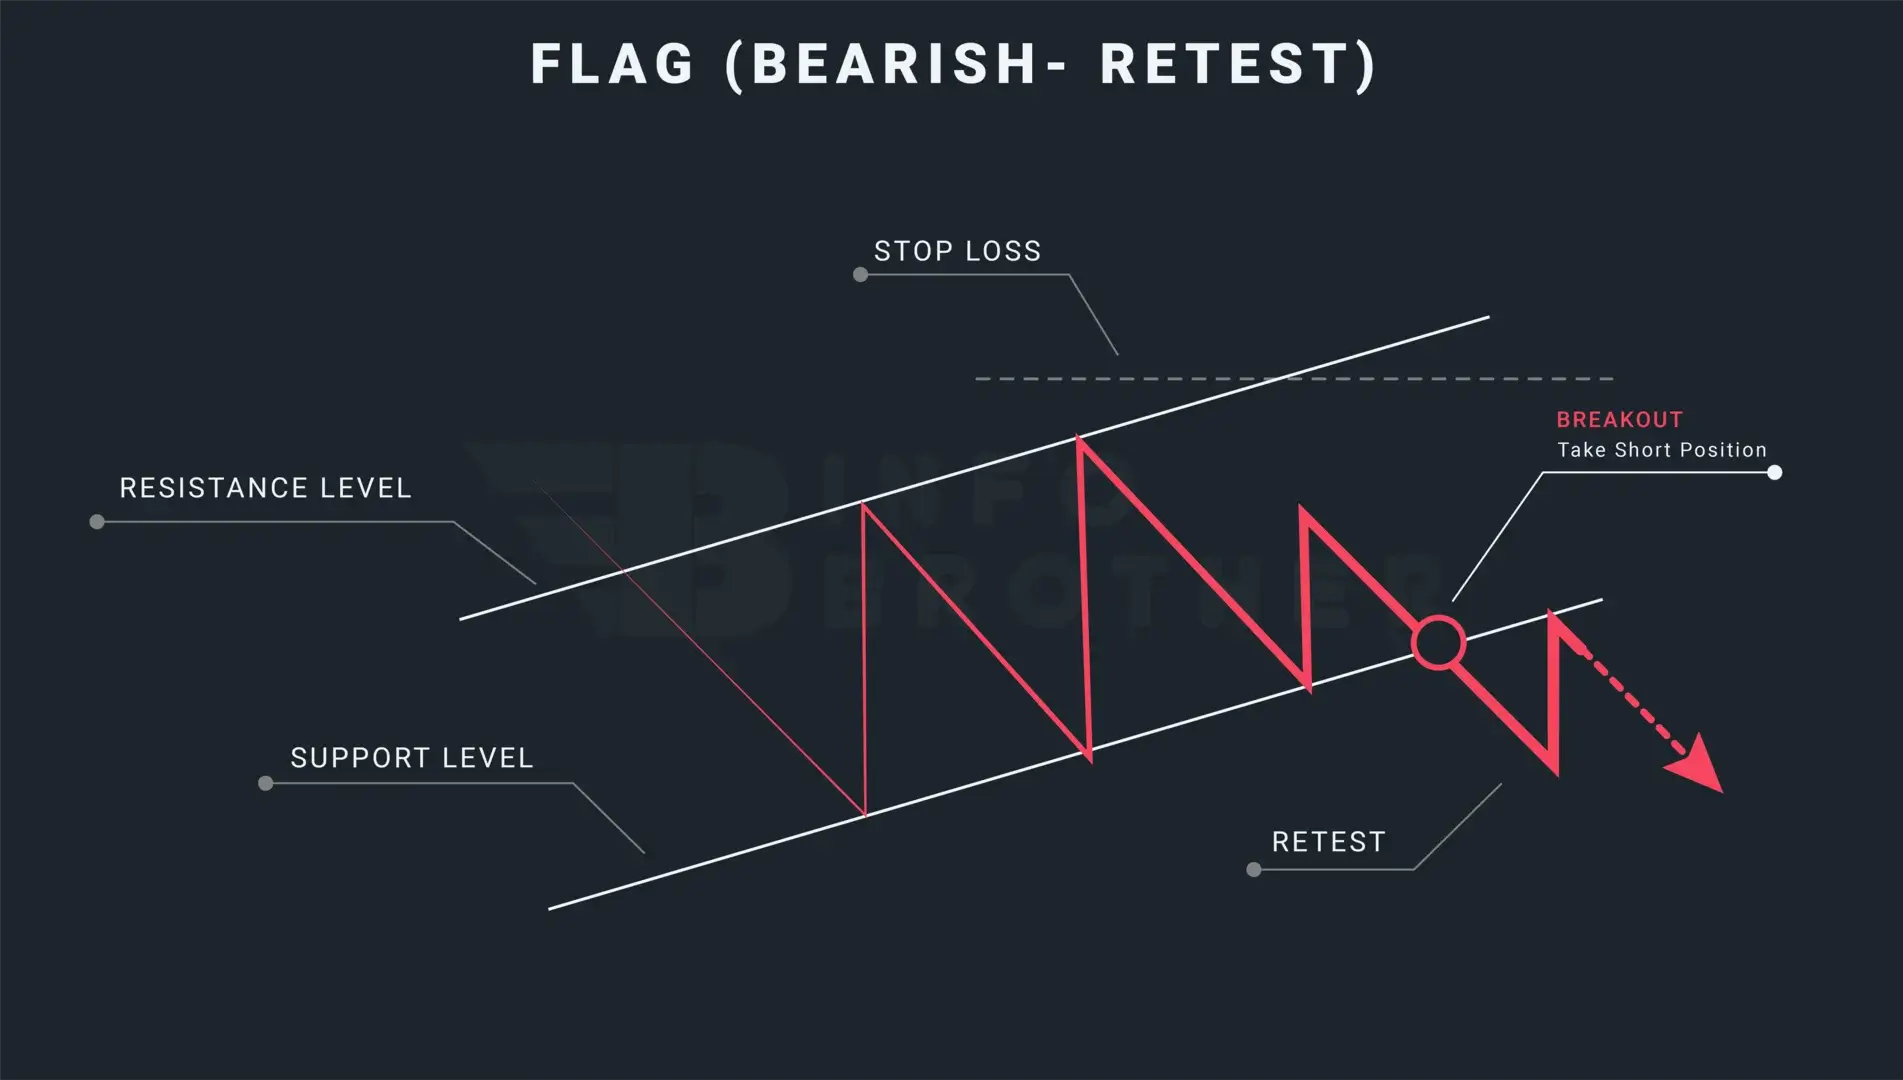
The process of the price returning to the level that the market previously broke is known as retesting. To avoid false breakouts, traders might wait for a retest, which occurs when the price breaks through the trendline and returns to retest the just passed resistance.
