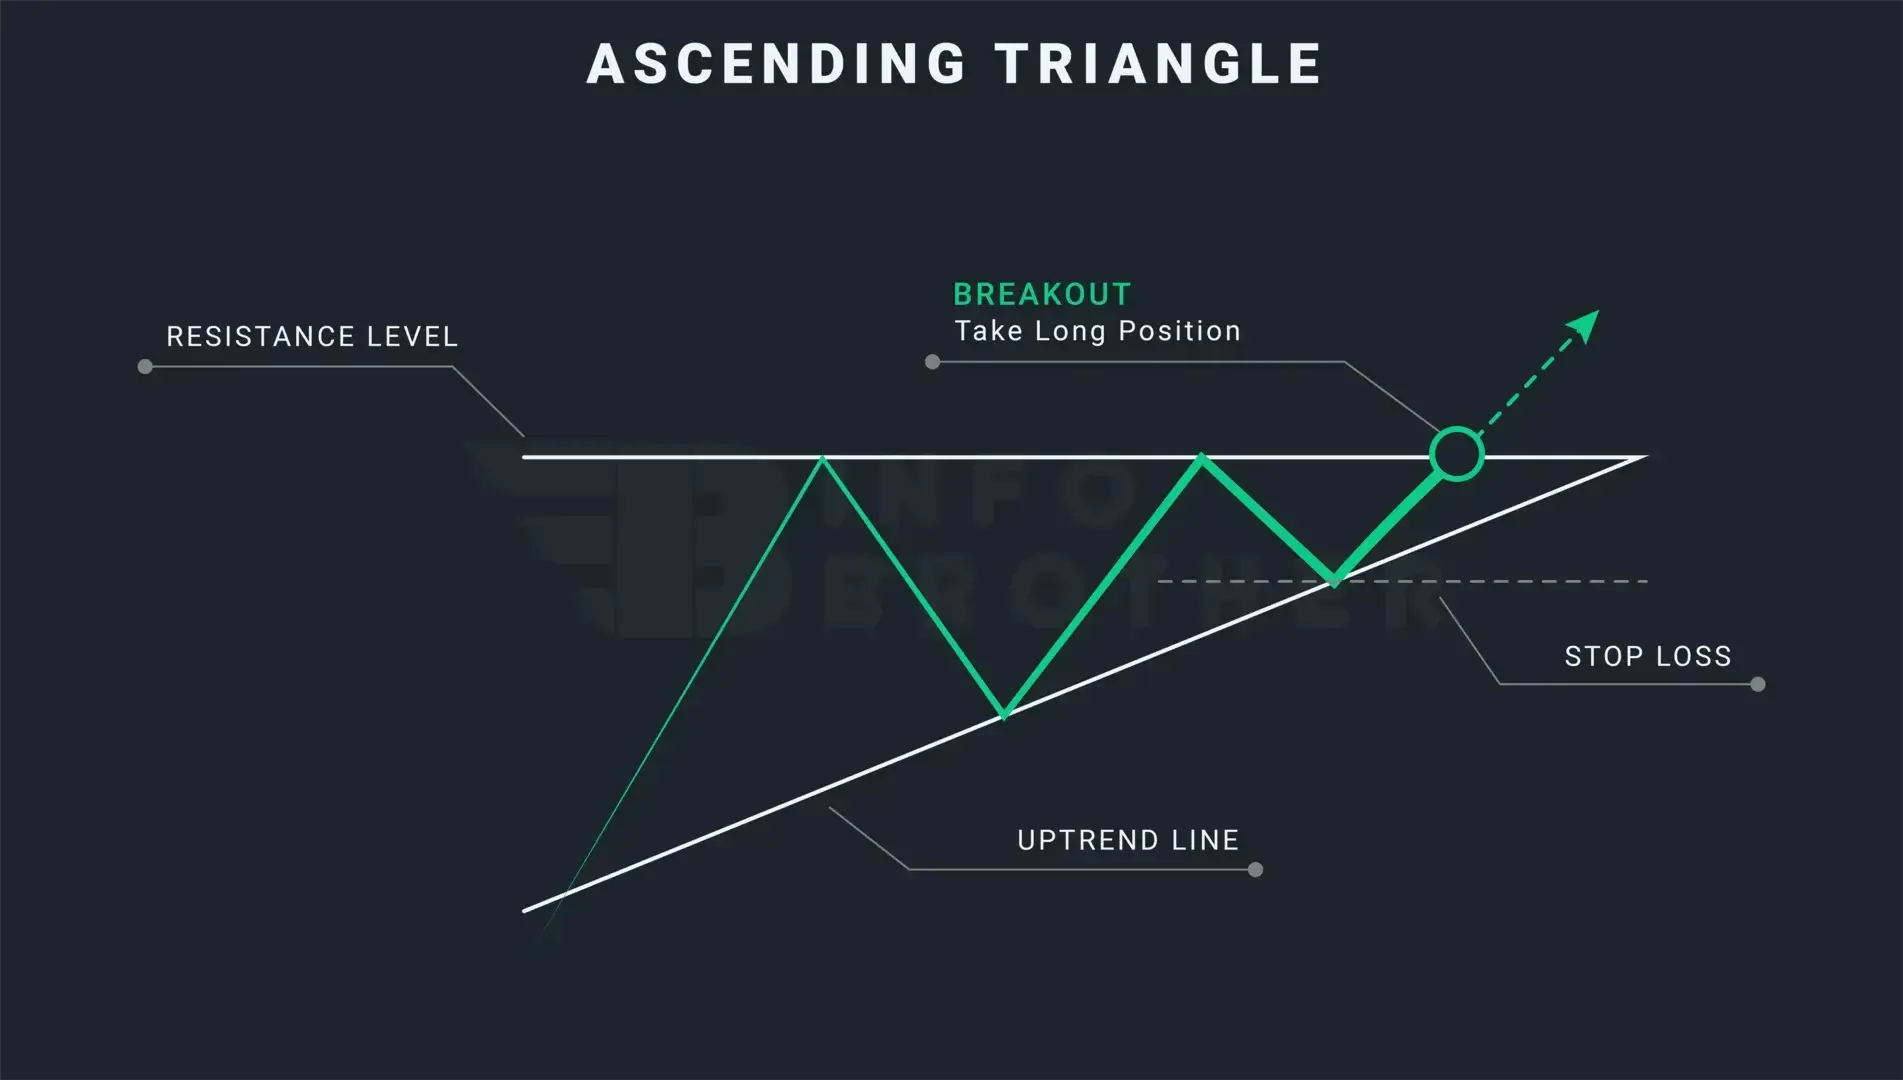
An ascending triangle is a technical chart pattern. It is formed by price movements that permit the drawing of a horizontal line along the swing highs and a rising trendline along the swing lows. The two lines intersect to form a triangle. Traders frequently look for triangle breakouts. The breakout might occur on the upside or downside.
Ascending triangles are sometimes referred to as continuation patterns since the price usually breaks out in the same direction as the trend that existed prior to the triangle forming.
The position of the ascending triangle with regard to the trend will indicate whether a trend reversal or continuation is more likely. An ascending triangle can form at the bottom of a downtrend, indicating that the downward momentum is diminishing before potentially turning direction. As a result, the place where the pattern appears is significant.
An ascending triangle is commonly seen as a continuation pattern. This pattern is important for traders because of its high accuracy rate. If this pattern appears within an uptrend , the chances of the trend continuing are 98%.
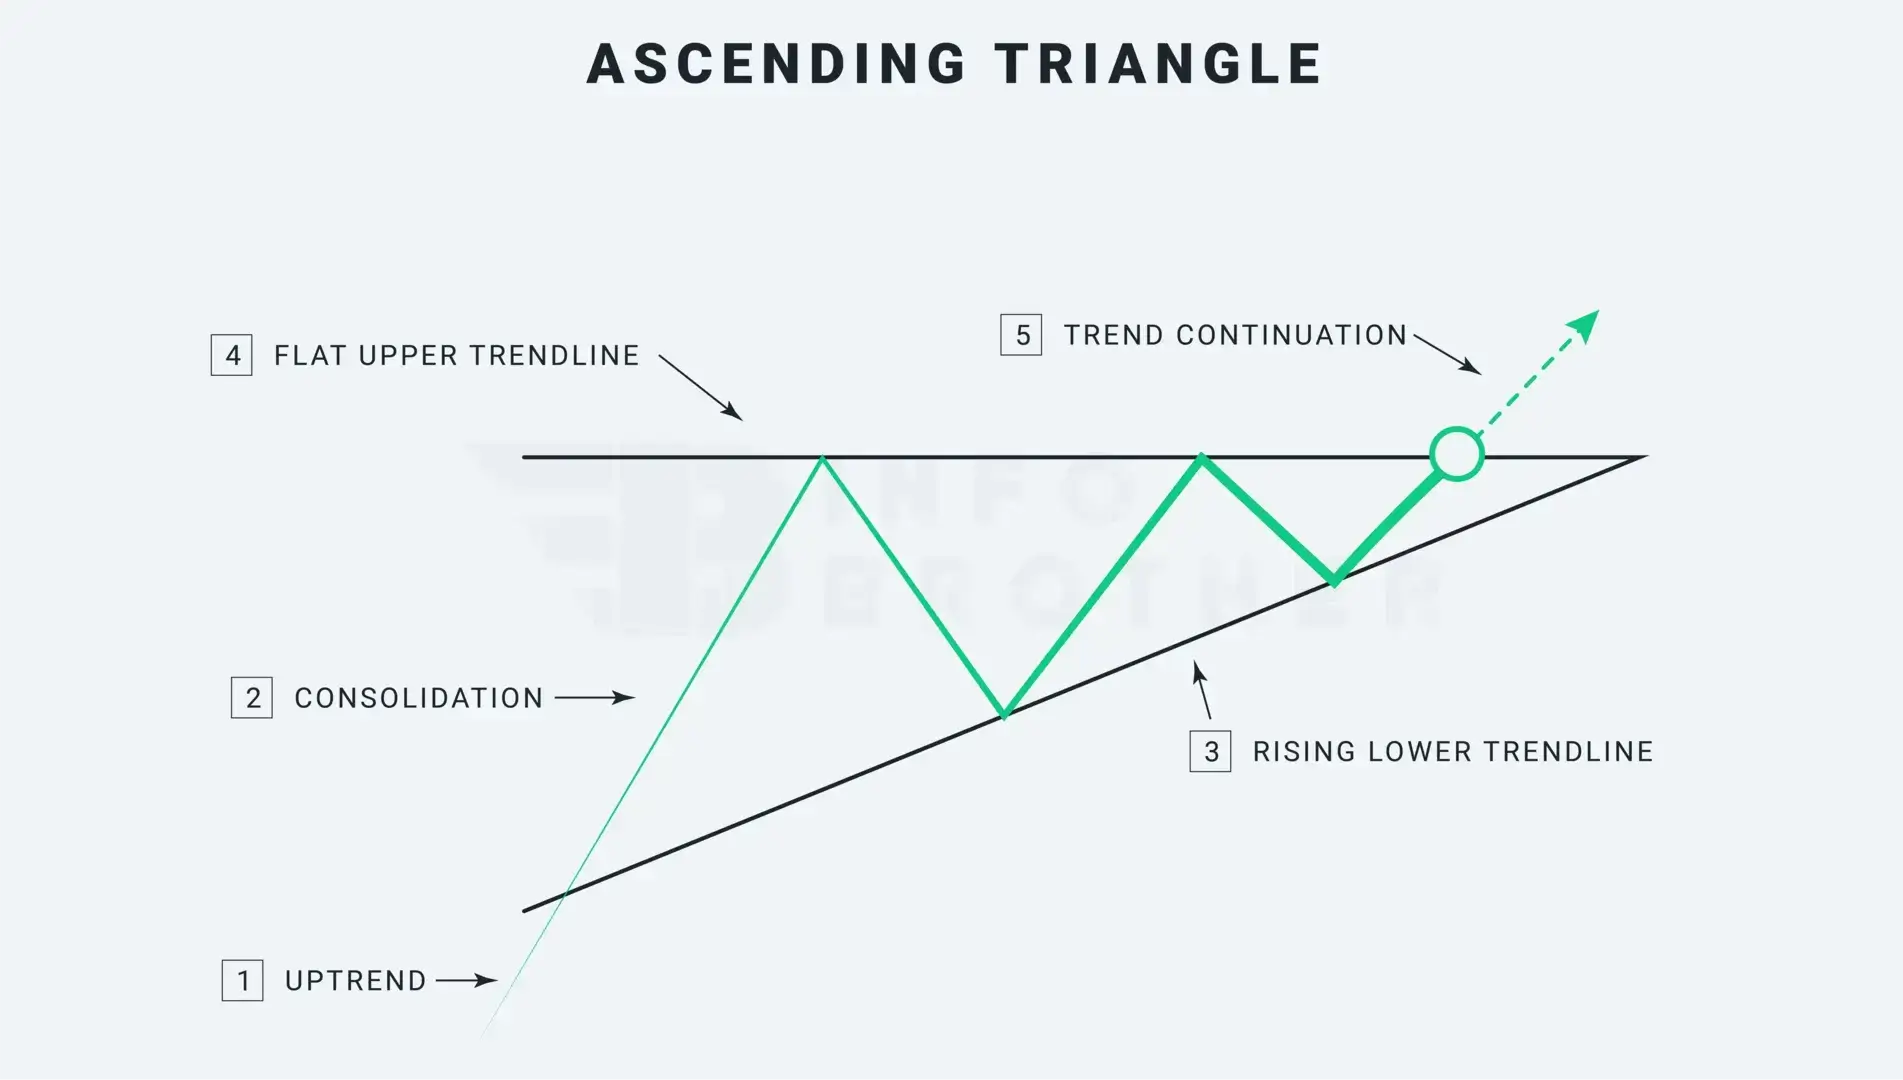
We have five elements to consider in order to determine the pattern.
1. Uptrend:
Before the ascending triangle occurs, the market must be in an uptrend . If the trend is sideways or downward , the trader should avoid this pattern. The upswing preceding this pattern is significant.
2. Consolidation:
As the market enters the consolidation phase, the ascending triangle pattern begins to take shape.
3. Rising Lower Trendline:
When the market is in a consolidation period, draw the trend line by linking the lows. This rising trend line indicates that buyers are gradually pushing up the price, providing more support for a bull market.
4. Flat Upper Trendline:
Use the upper trendline as a level of resistance . Price frequently approaches this level and bounces off until the breakthrough happens.
5. Trend continuation:
The breakout occurs and the price breaks above the higher trendline. The pattern will be confirmed by traders, and the trend will continue upward.
The ascending triangle's trendlines must have at least two swing highs and two swing lows. However, a higher number of trendline contacts produces more consistent trading results.
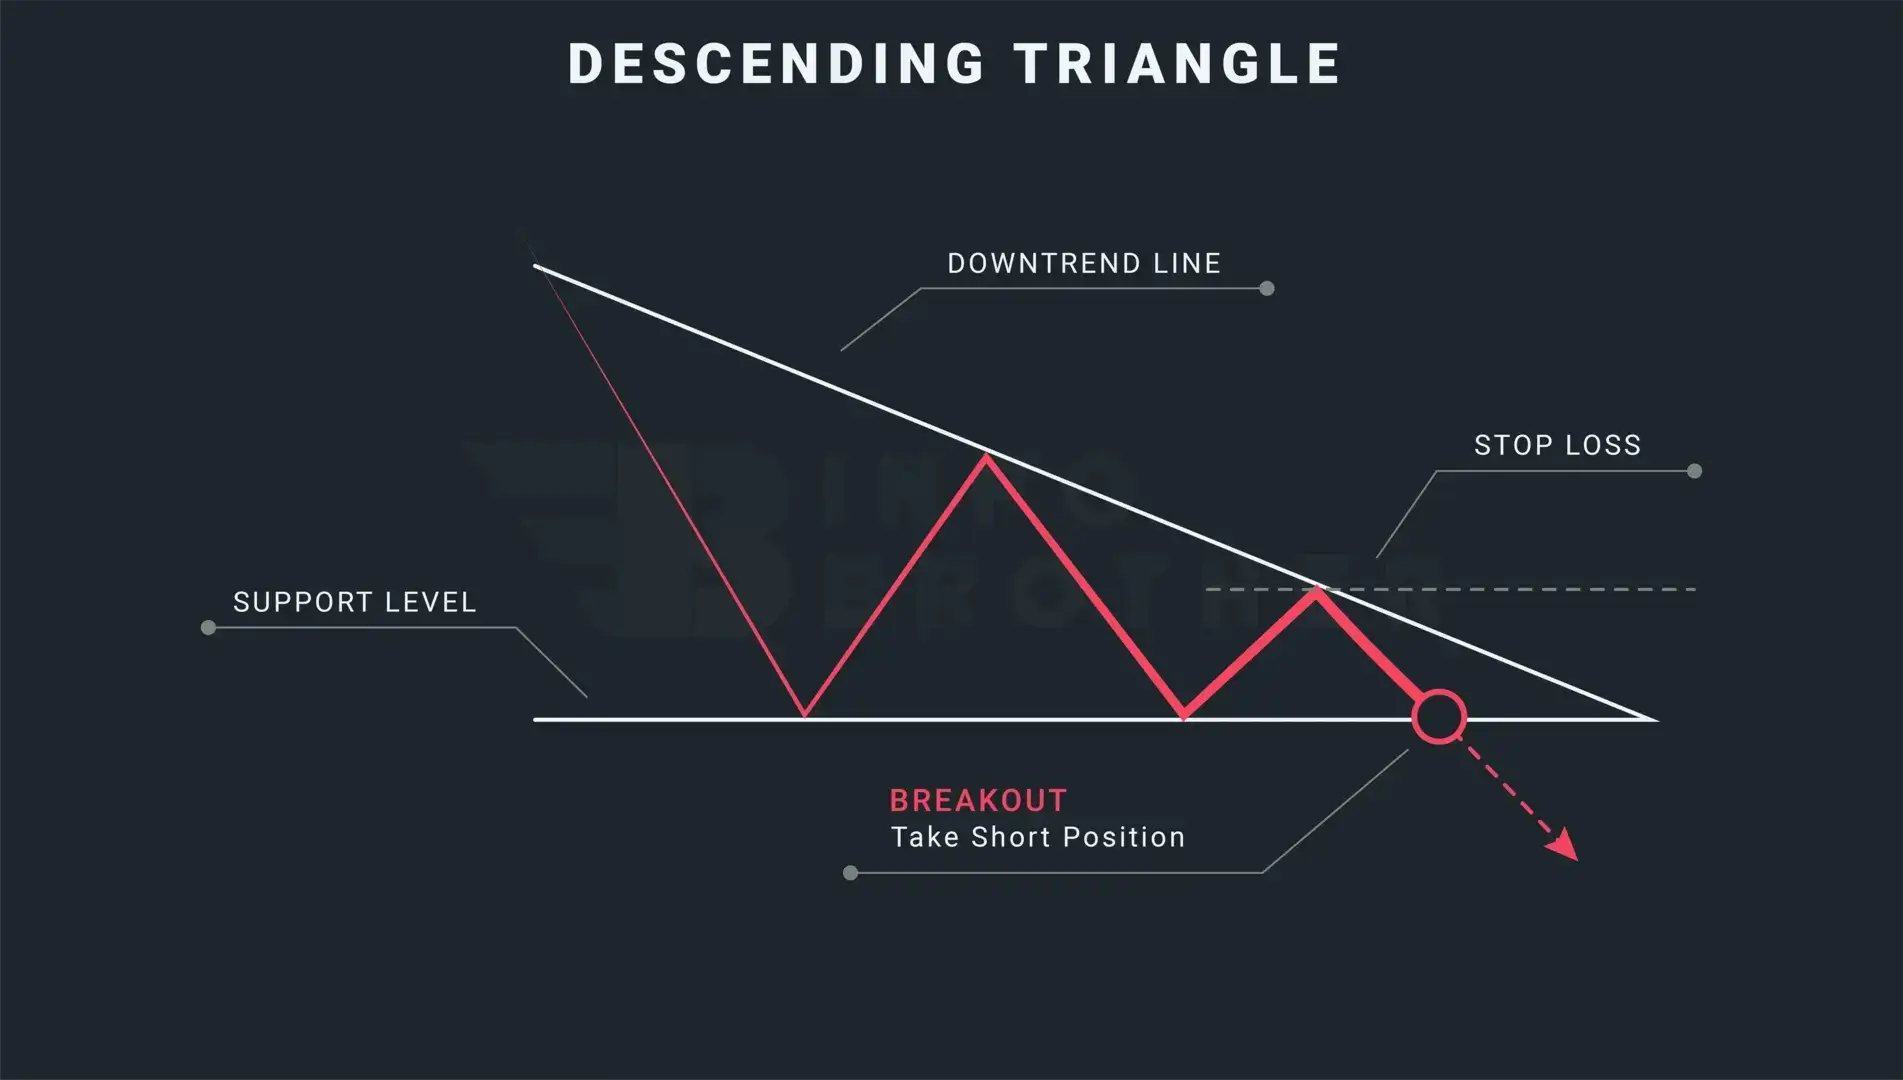
The Difference Between an Ascending Triangle and a Descending Triangle:
Both of these triangles are continuation patterns, but they have a different appearance. A flat lower support level and a falling lower trendline define the descending triangle.
Read More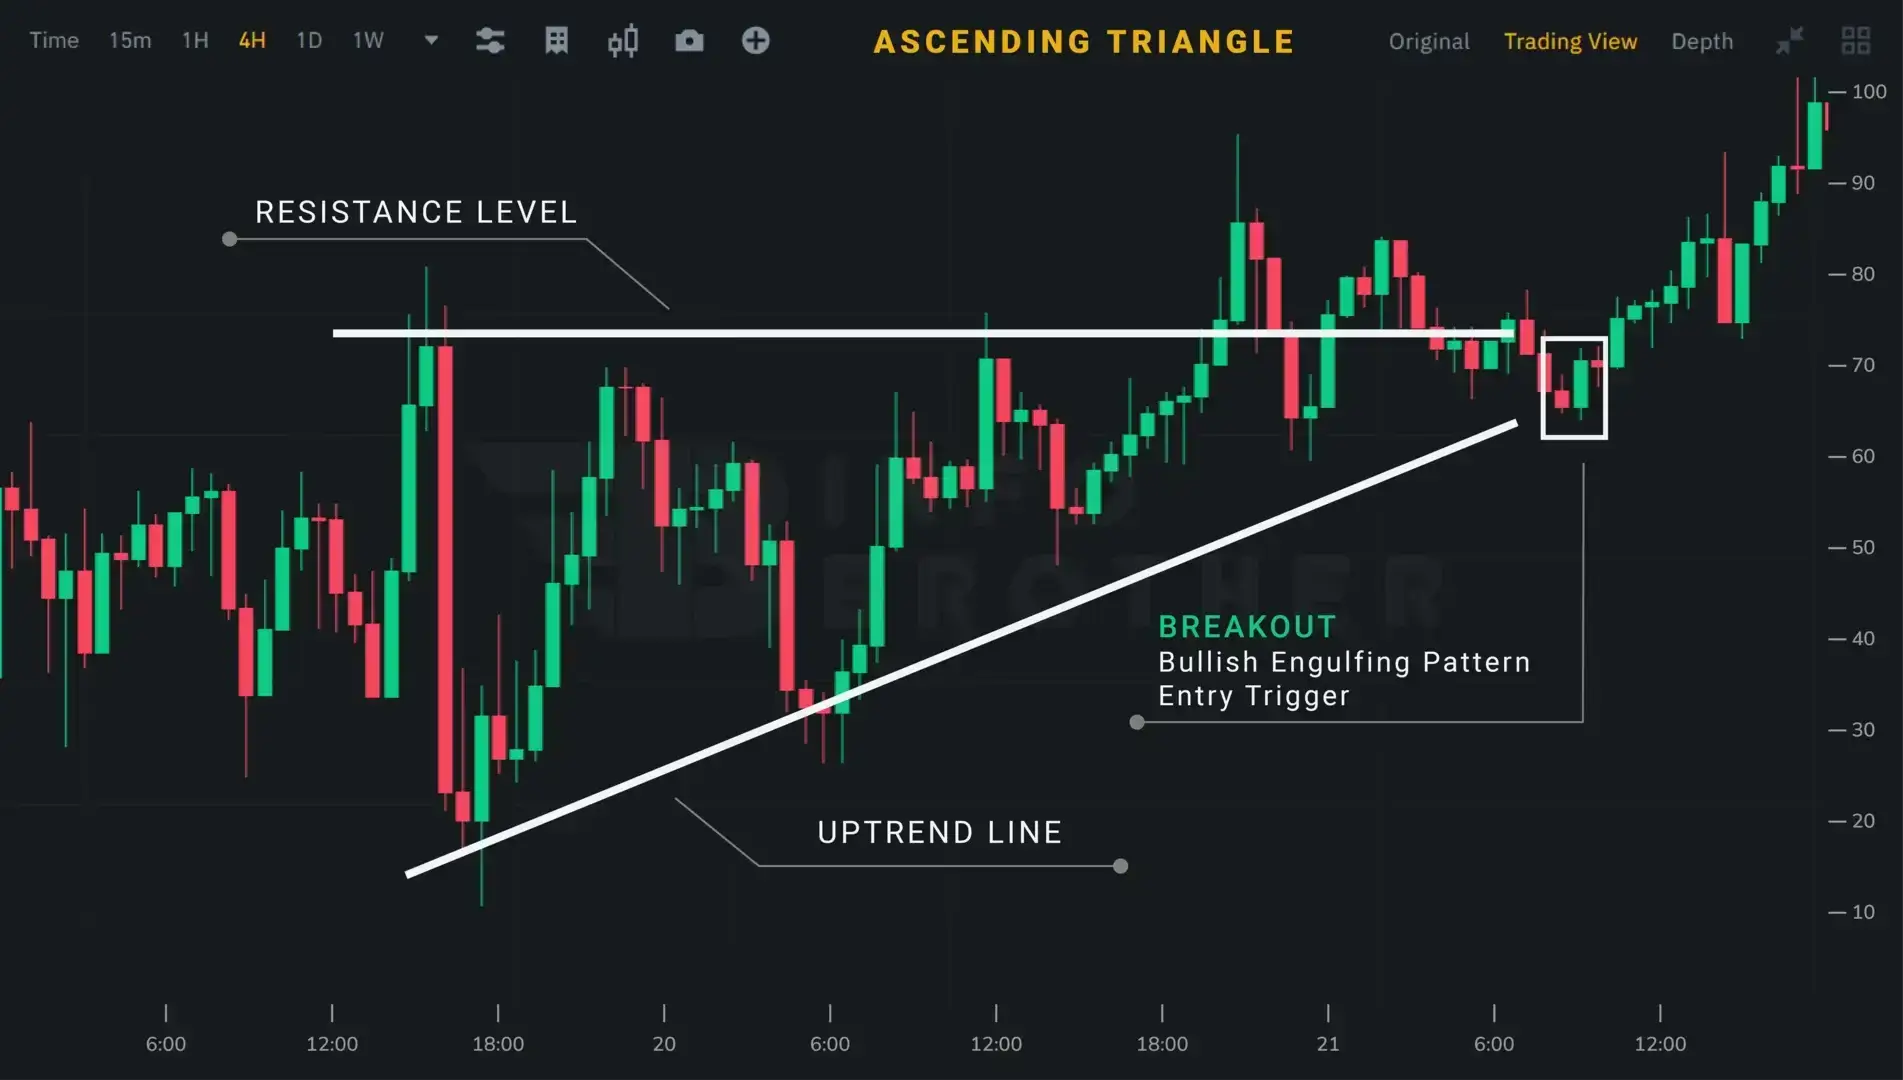
When a breakout occurs, traders enter the market. If the breakout occurs to the upside, buy/long; if the breakout occurs to the downside, short/sell. A stop-loss should be positioned just outside the pattern's opposing side. A stop-loss should be put slightly below the lower trendline if a long trade is executed on an upside breakout. A stop-loss should be put slightly above the upper resistance level if a short trade is executed on a downward breakout.
The primary issue with these patterns is the possibility of false breakouts. The price may move out of the pattern just to return to it, or it may even break out the opposite way. A trader can prevent this by waiting for the retest.
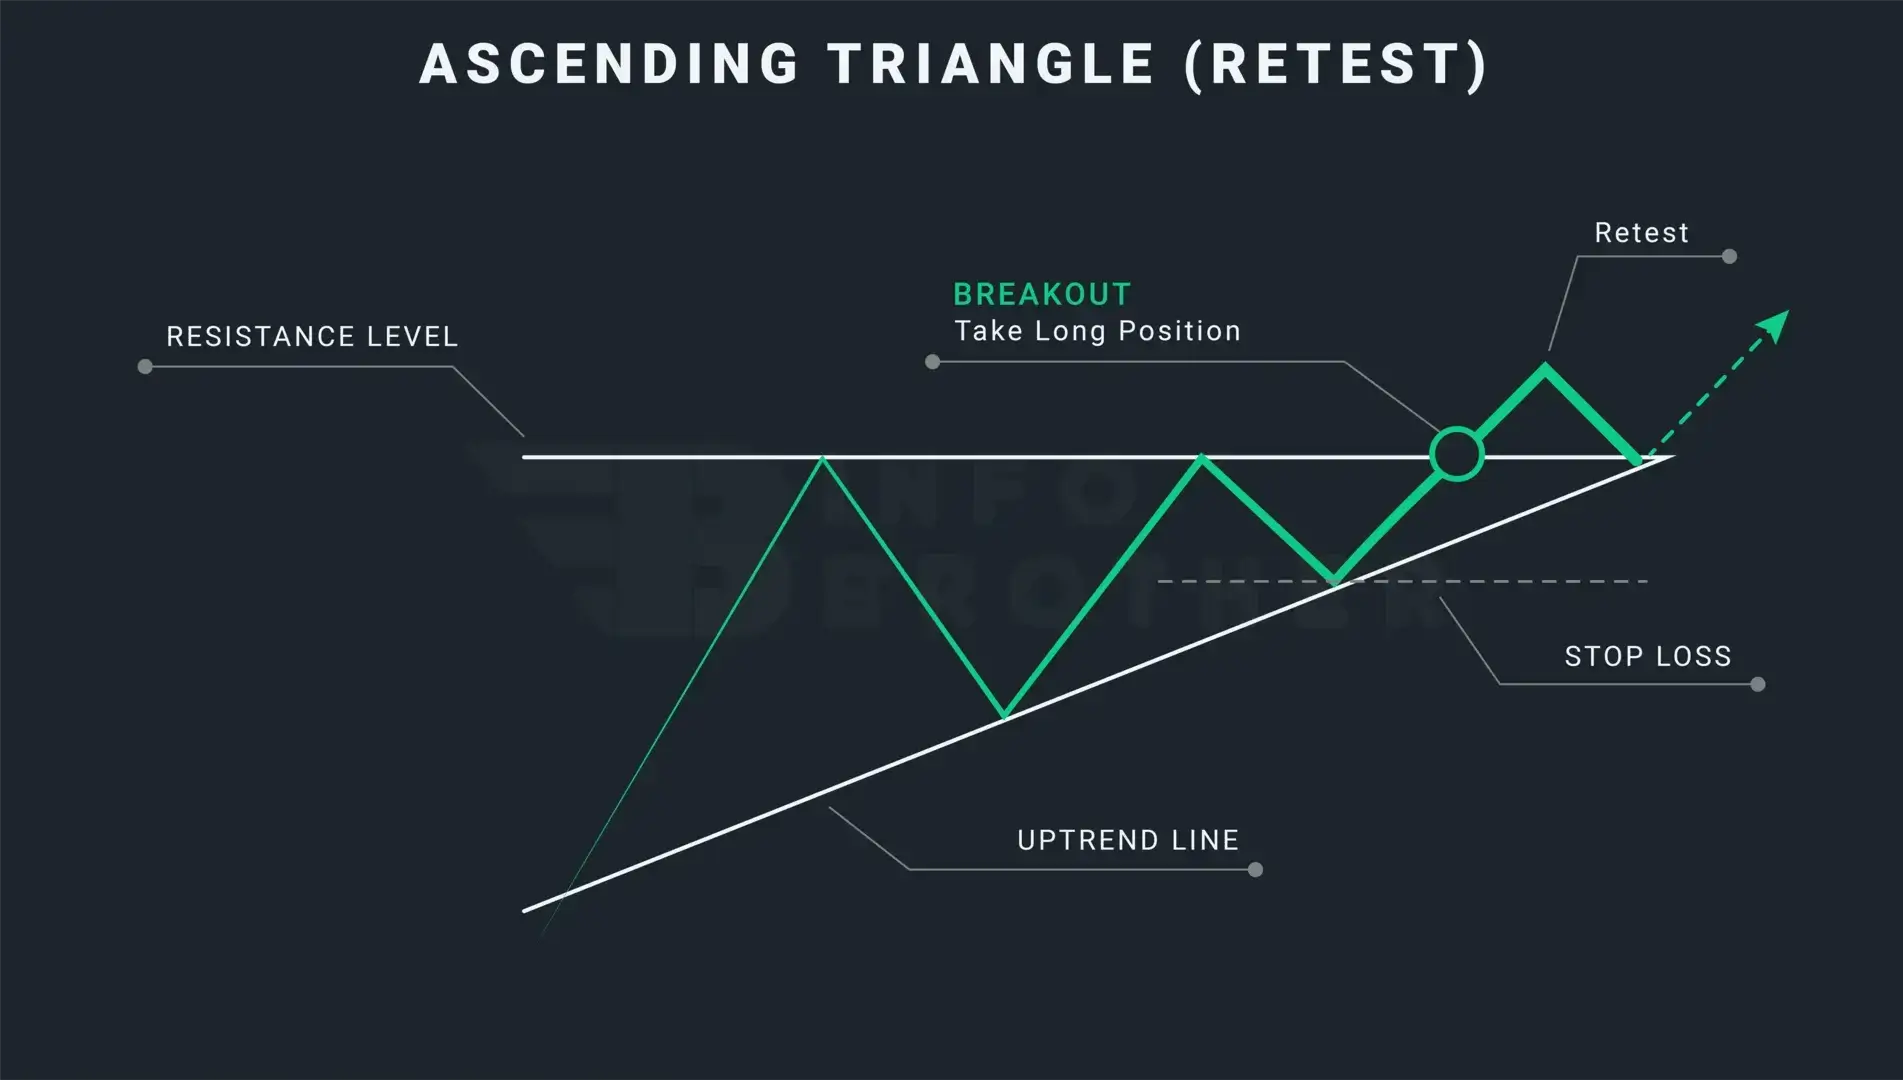
The process of the price returning to the level that the market previously broke is known as retesting. To avoid false breakouts, traders might wait for a retest, which occurs when the price breaks through the trendline and returns to retest the just passed resistance.
