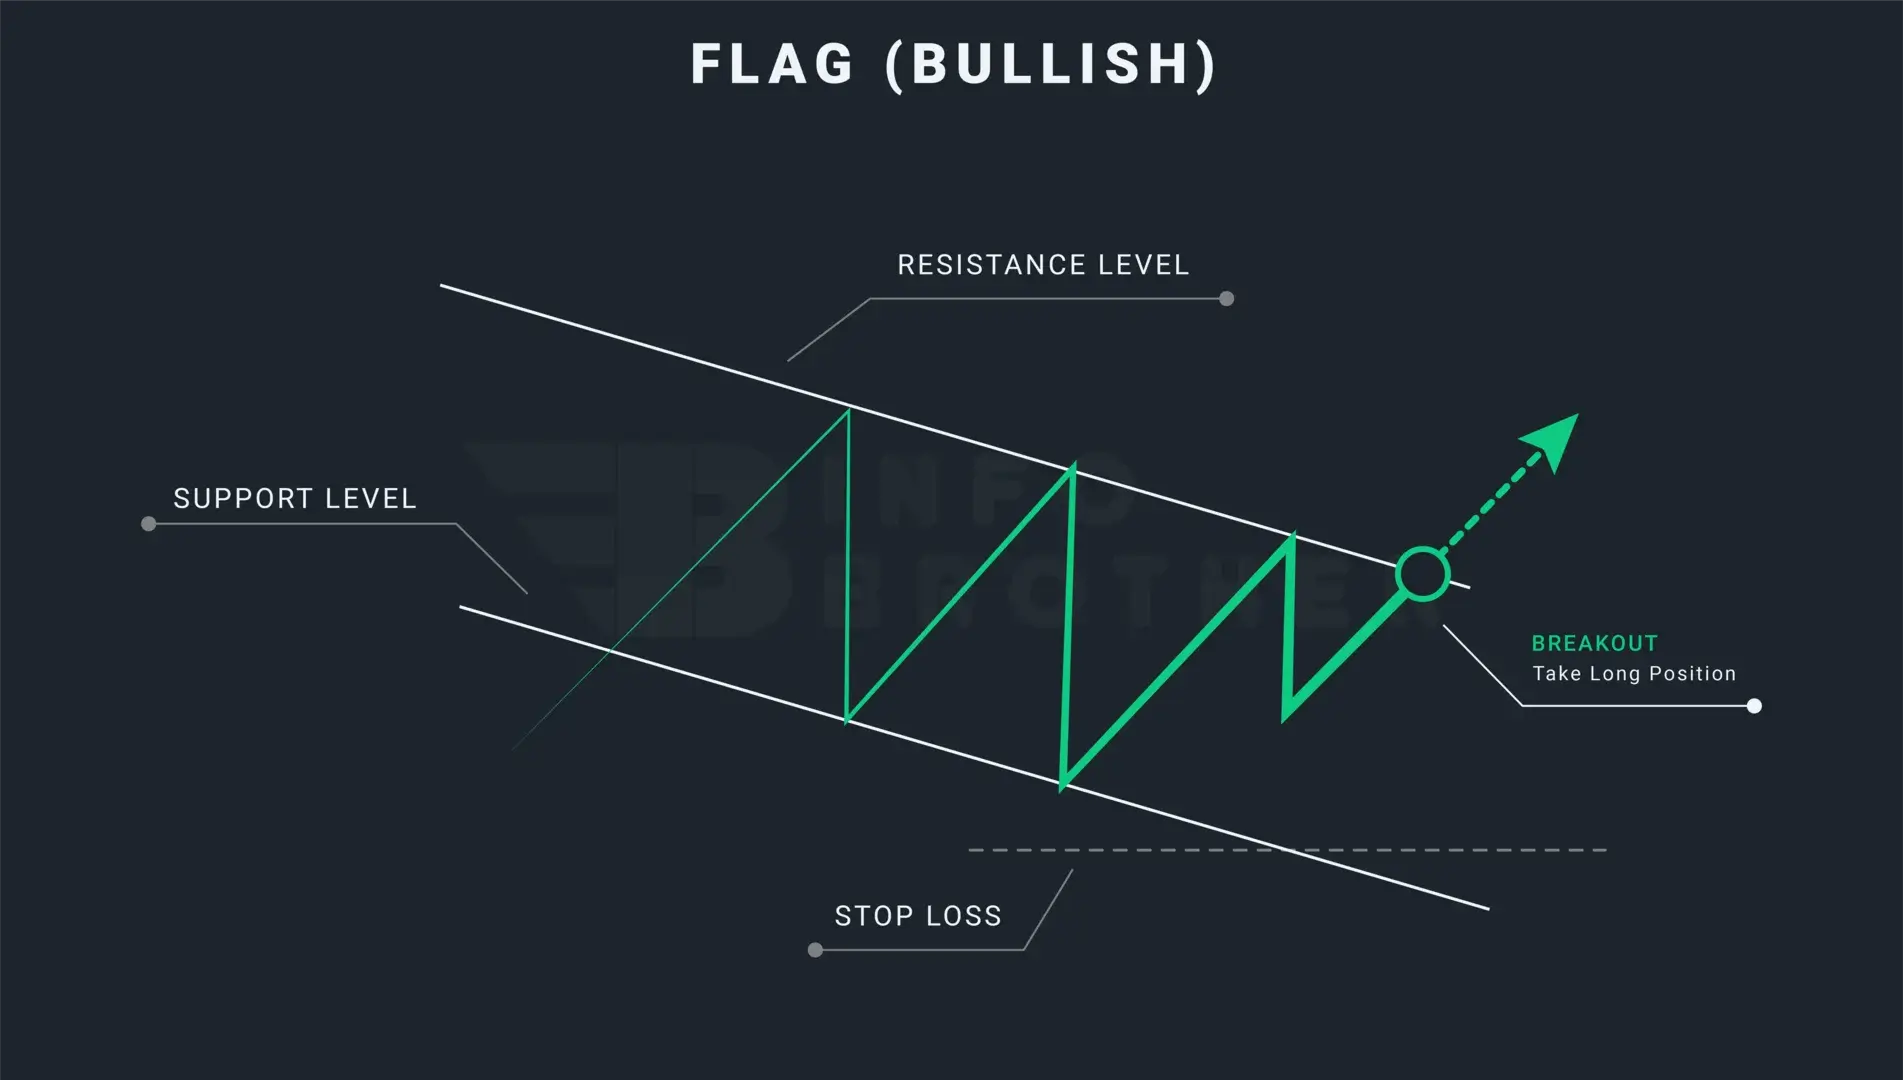
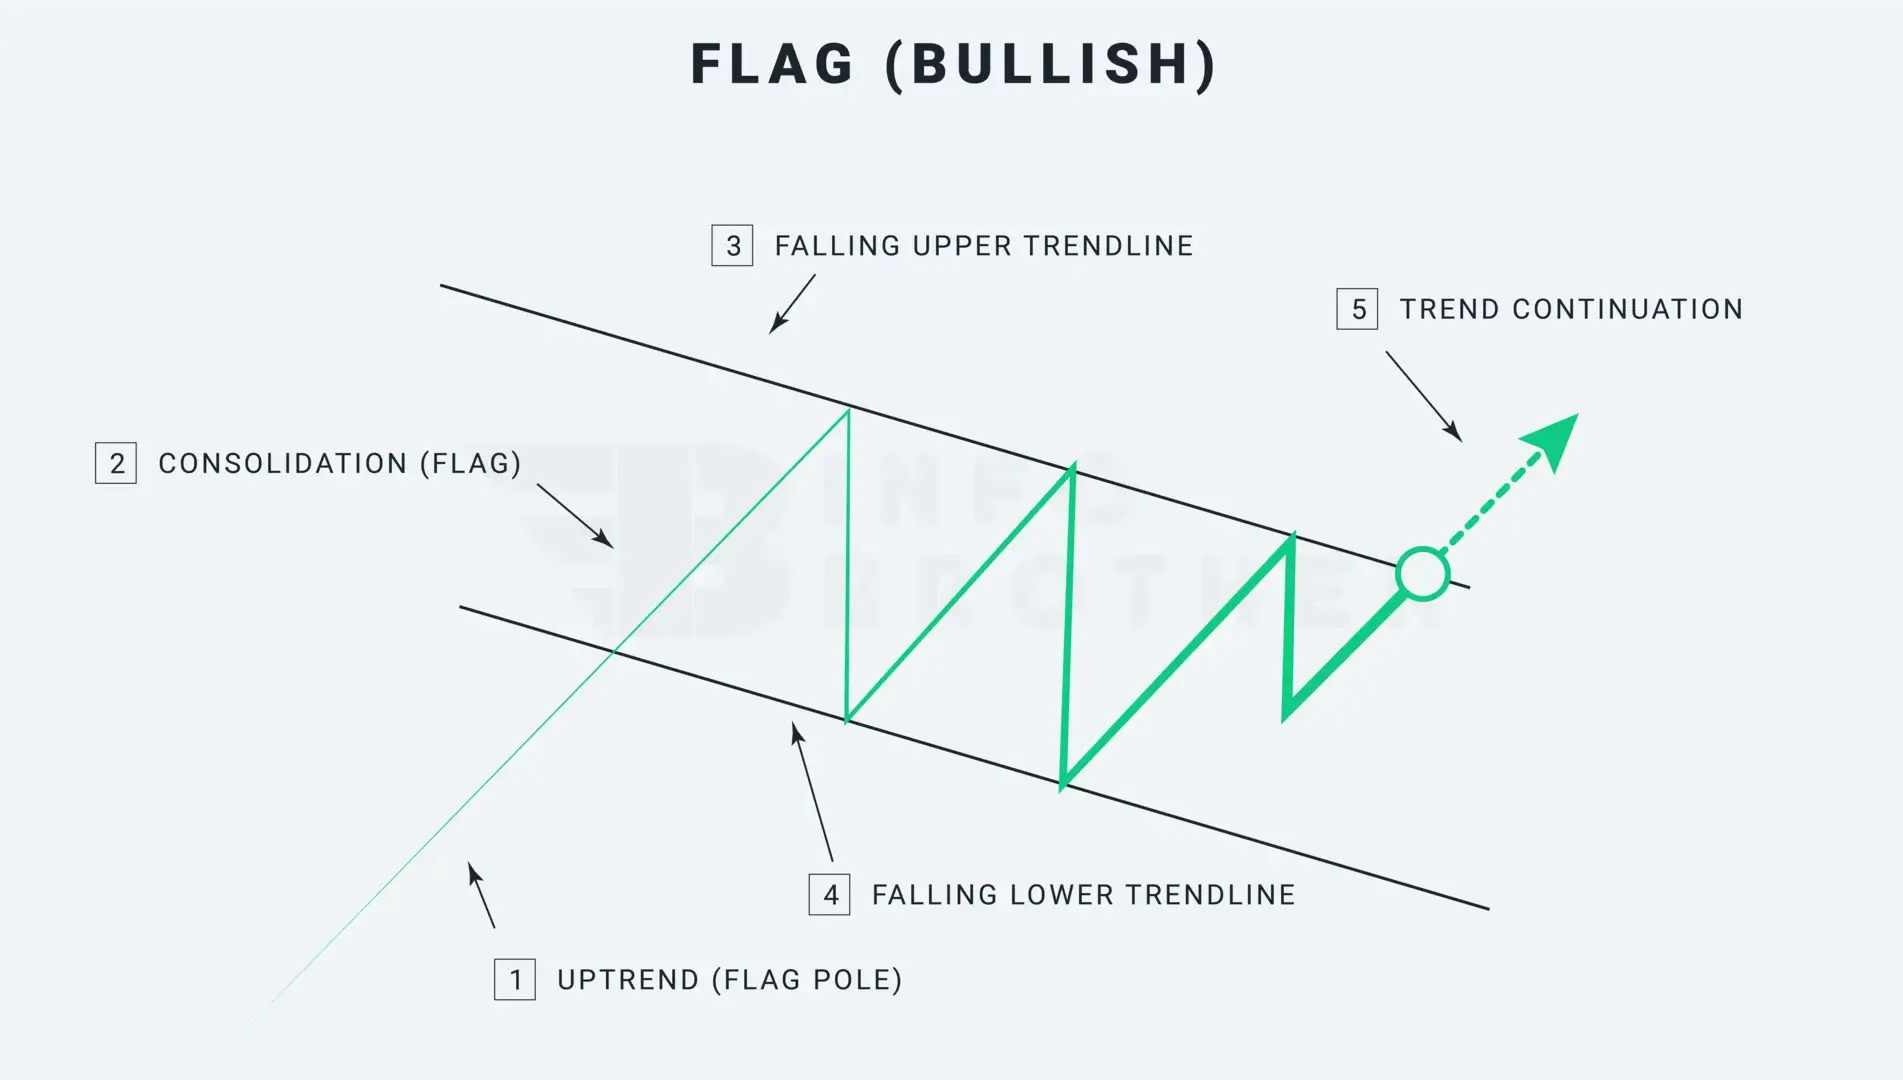
A bullish flag is a continuation pattern observed in markets with strong uptrends that informs traders that the trend will continue rising. We termed this formation a 'bullish flag' since it looks like a flag on a pole. The pole represents a significant vertical climb in the market, while the flag represents a period of consolidation. The flag can be a horizontal rectangle, but it is also found in an angle-down shape that is opposite the current trend.
Because of the tremendous trends that experienced investors may benefit from, the bulls' flag patterns are ideal for the cryptocurrency market circumstances. This pattern works well whether we want to utilize it for day trading or swing trading. Flag patterns are useful for trading after a breakout or in a market that is strongly moving.
Most traders confuse flag patterns with pennant patterns. However, these two designs are diametrically opposed. The fundamental contrast between the flag pattern and the pennant pattern is the appearance of support and resistance levels inside the formations. Flag patterns are made up of two parallel lines, whereas pennant patterns are made up of support and resistance lines that converge on an apex.
The bull flag pattern is a chart pattern that extends the uptrend. Before breaking out and continuing the uptrend, price movement consolidates inside two parallel lines in the opposite direction of the upward trend. If this pattern happens within an uptrend, the trend has a 98% chance of continuing.
There are five factors to examine while determining a bullish flag pattern.
1. Uptrend (Flagpole)
Prior to the formation of the bullish flag pattern, the market must be in an upward trend. This design differs from others, such as the symmetrical triangle, in that it always begins with a flagpole. Traders should avoid this pattern if the trend is down or sideways.
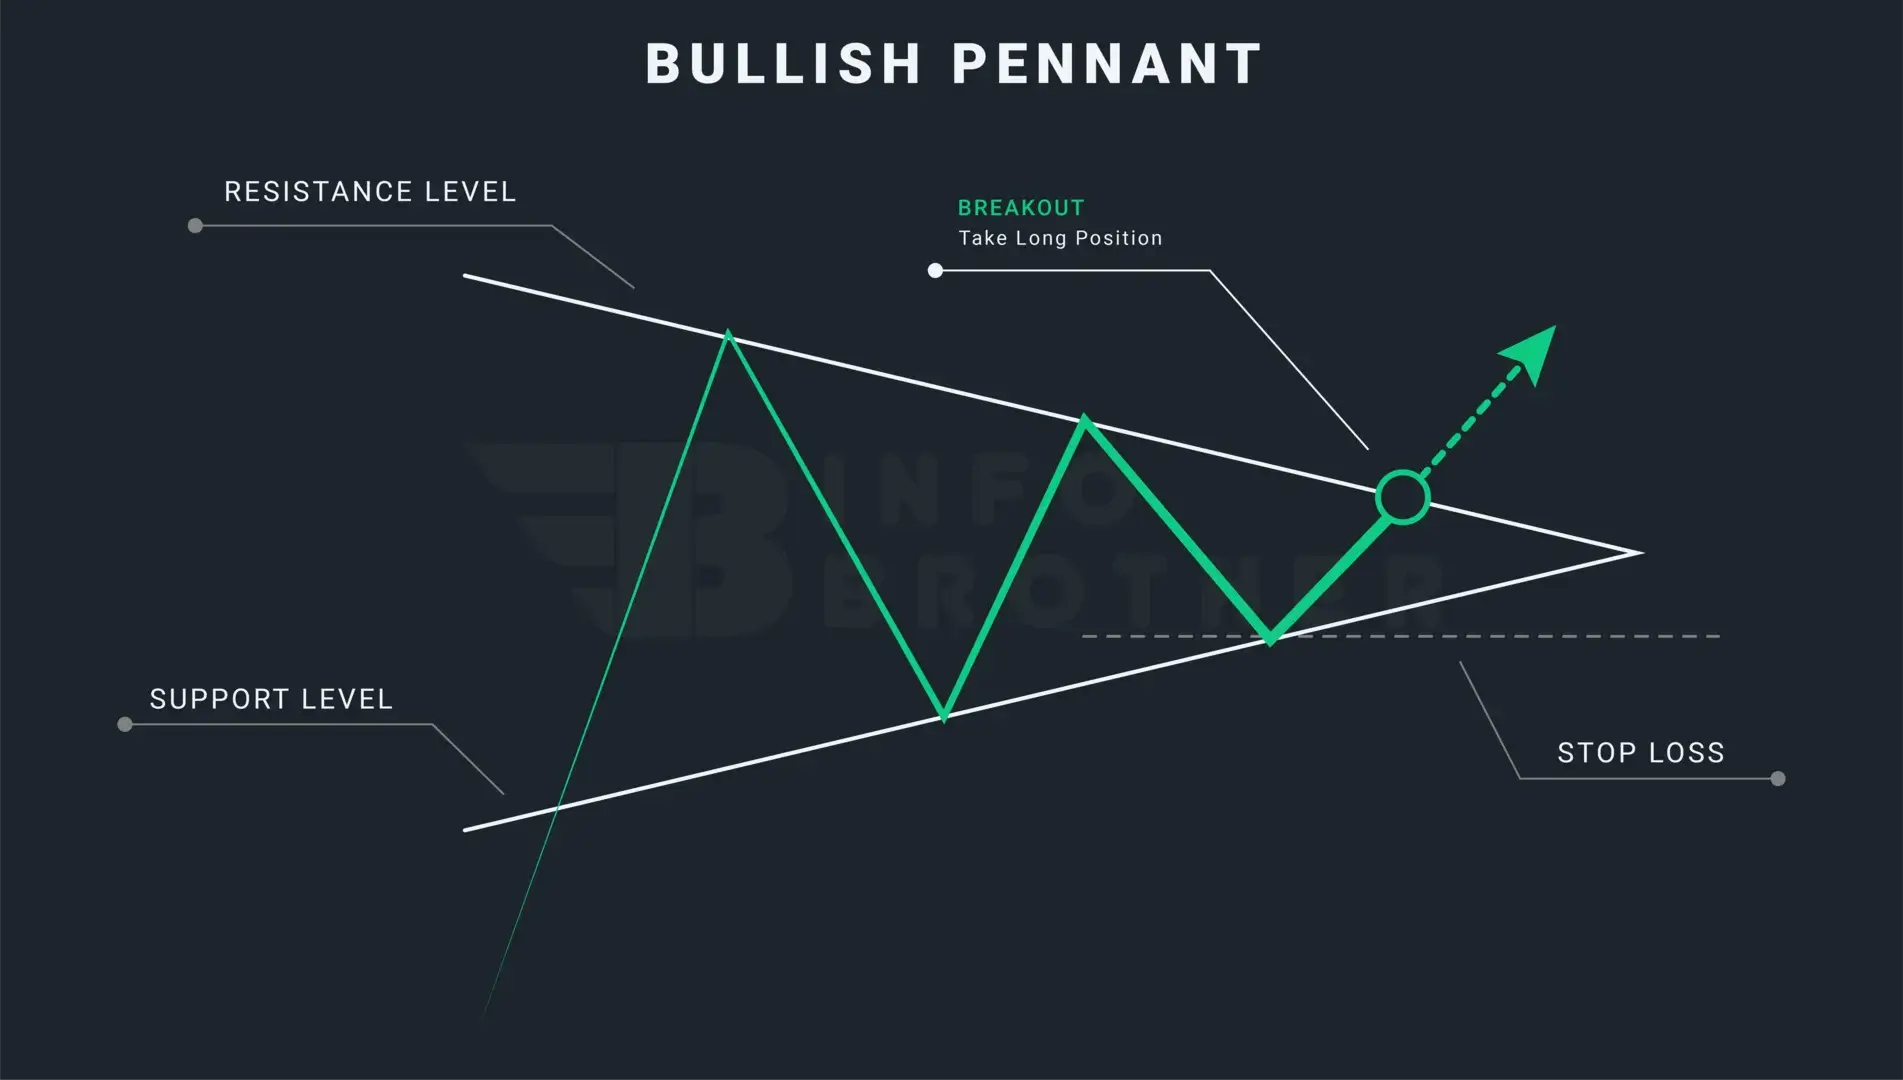
The Difference Between a Flag Pattern and a Pennant Pattern:
The look of the support and resistance levels inside the formations is the primary distinction between a flag pattern and a pennant pattern.
Read More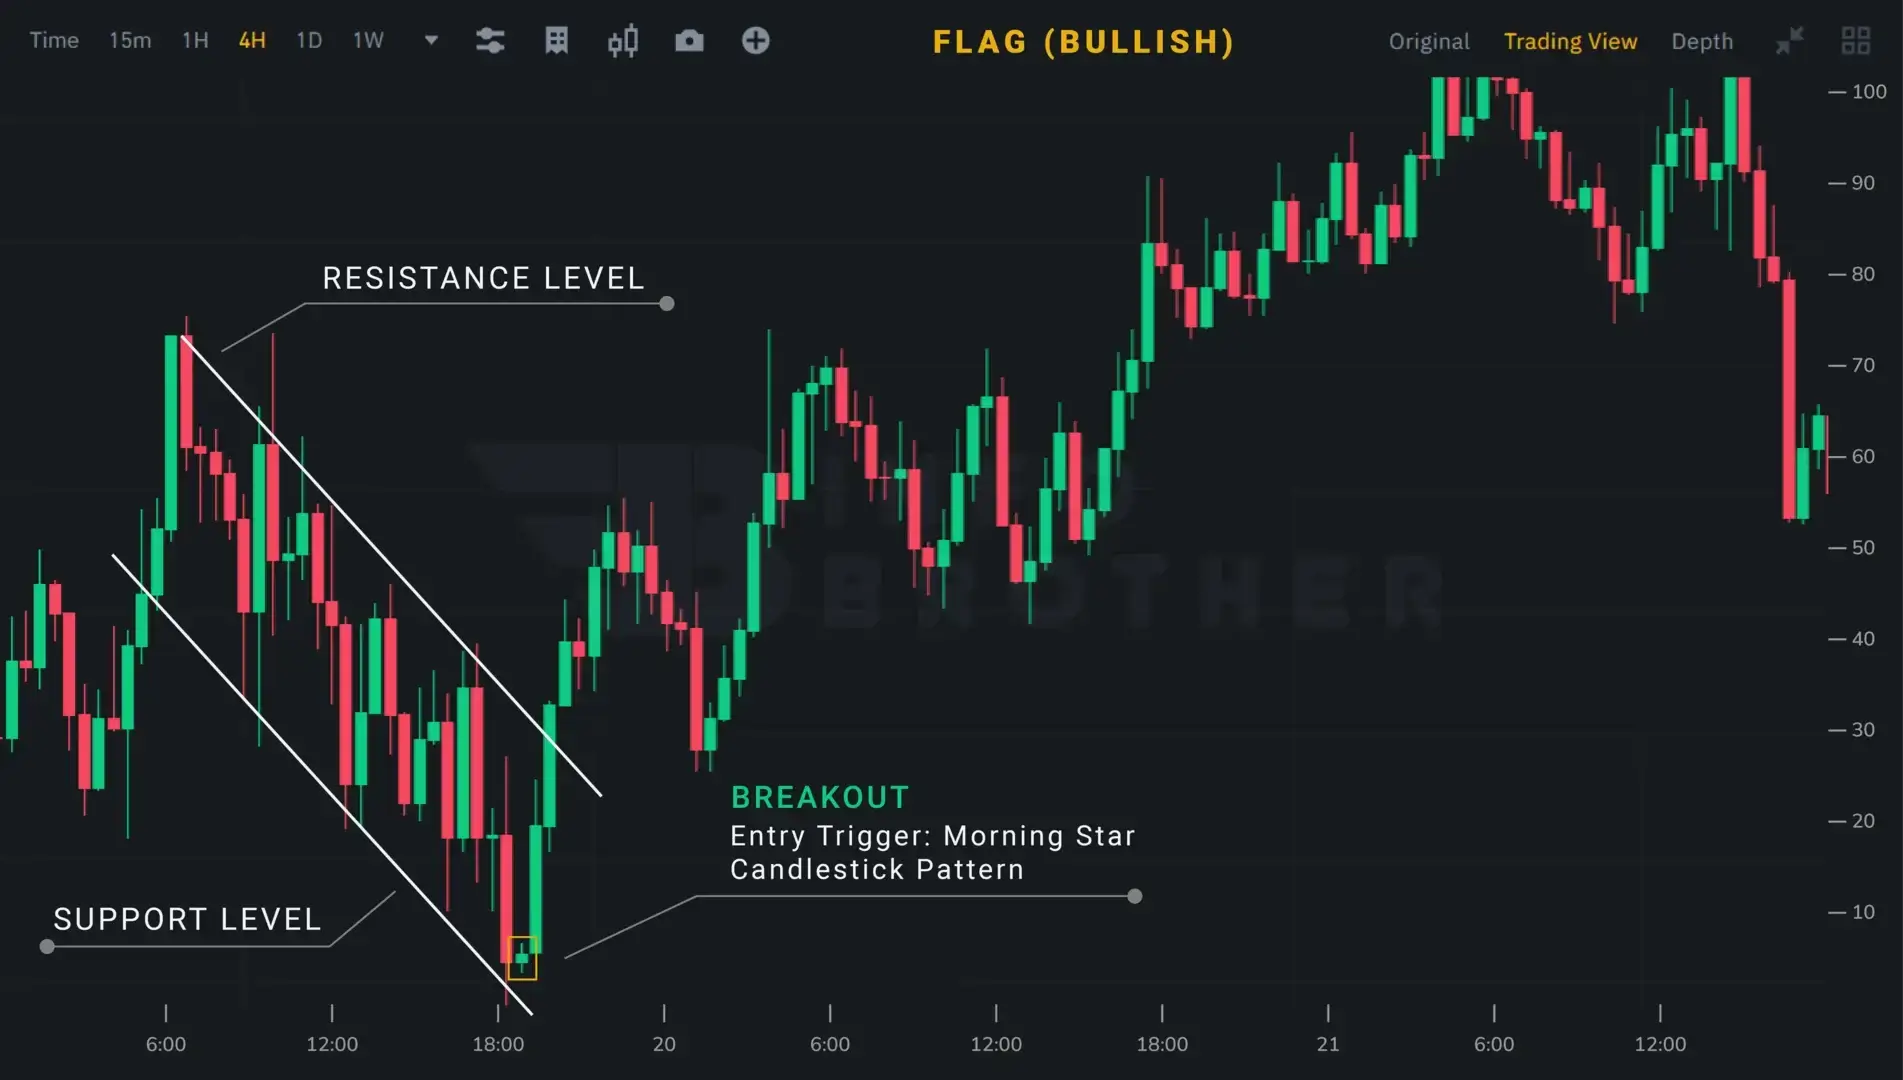
Trading the bull flag pattern is a simple process as long as the prior part, identifying and sketching the formation, is done correctly. The bull flag shapes and forms the upswing, allowing traders to pinpoint entry and limit levels.
Traders enter at the close of the breakout candle or wait for the retest, which can be difficult because the price movement may never return to retest the broken resistance.
Any movement to the inside body of the flag renders the pattern invalid. To avoid false breakouts and market whipping in extremely volatile markets, we should follow the risk management rule and put the stop-loss right below the flag formation.
In the case of a take-profit, traders just copy and paste the flagpole from the point where the breakthrough occurred. The end point of the past trendline indicates a level where we should consider taking gains. At this moment, we will notice that the market reached this level and then slightly corrected lower, indicating that the take profit order of the bull flag has been reached.
Remember that market fluctuations aren't always predictable, so risk management methods should always be adopted before starting a trade. False breakouts may be a significant issue with these patterns. Price may deviate from the pattern only to re-enter it, or it may break out in the other direction. A trader can prevent this by waiting for the retest.
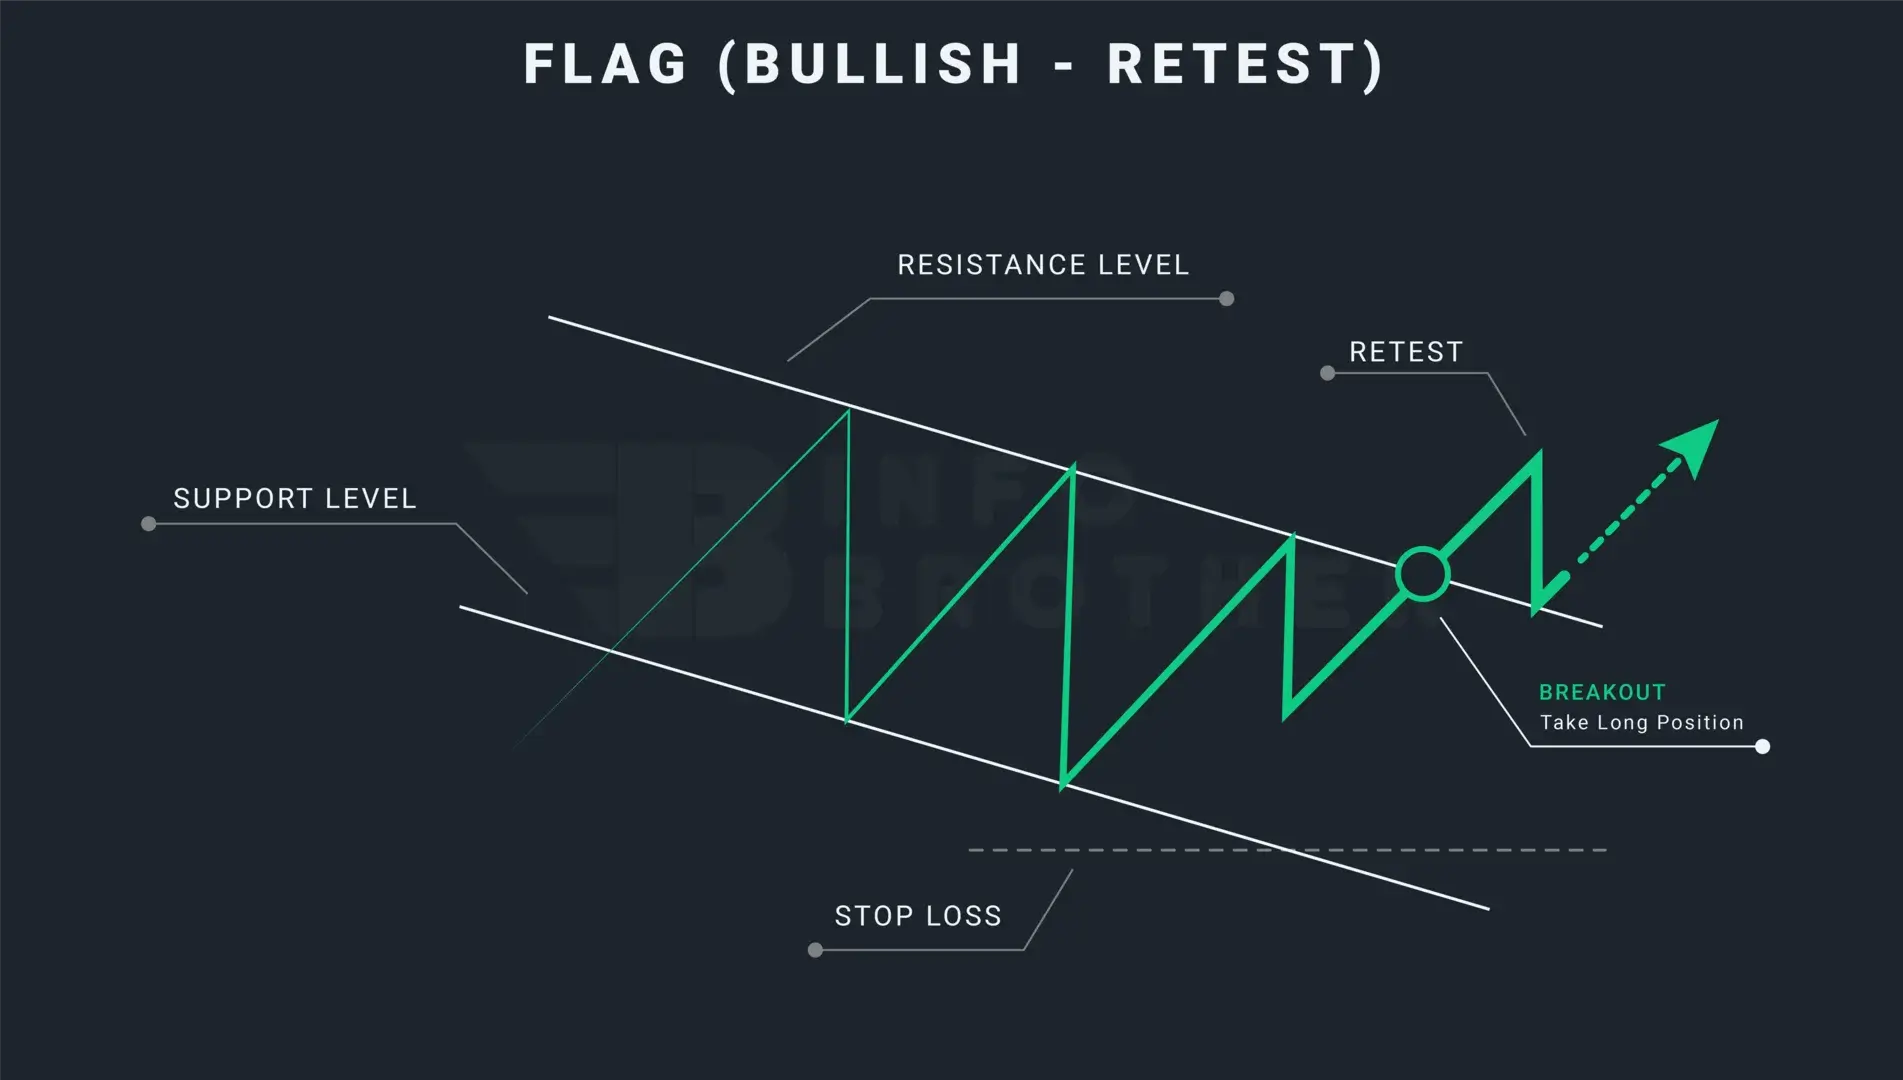
The process of the price returning to the level that the market previously broke is known as retesting. To avoid false breakouts, traders might wait for a retest, which occurs when the price breaks through the trendline and returns to retest the just passed resistance.
