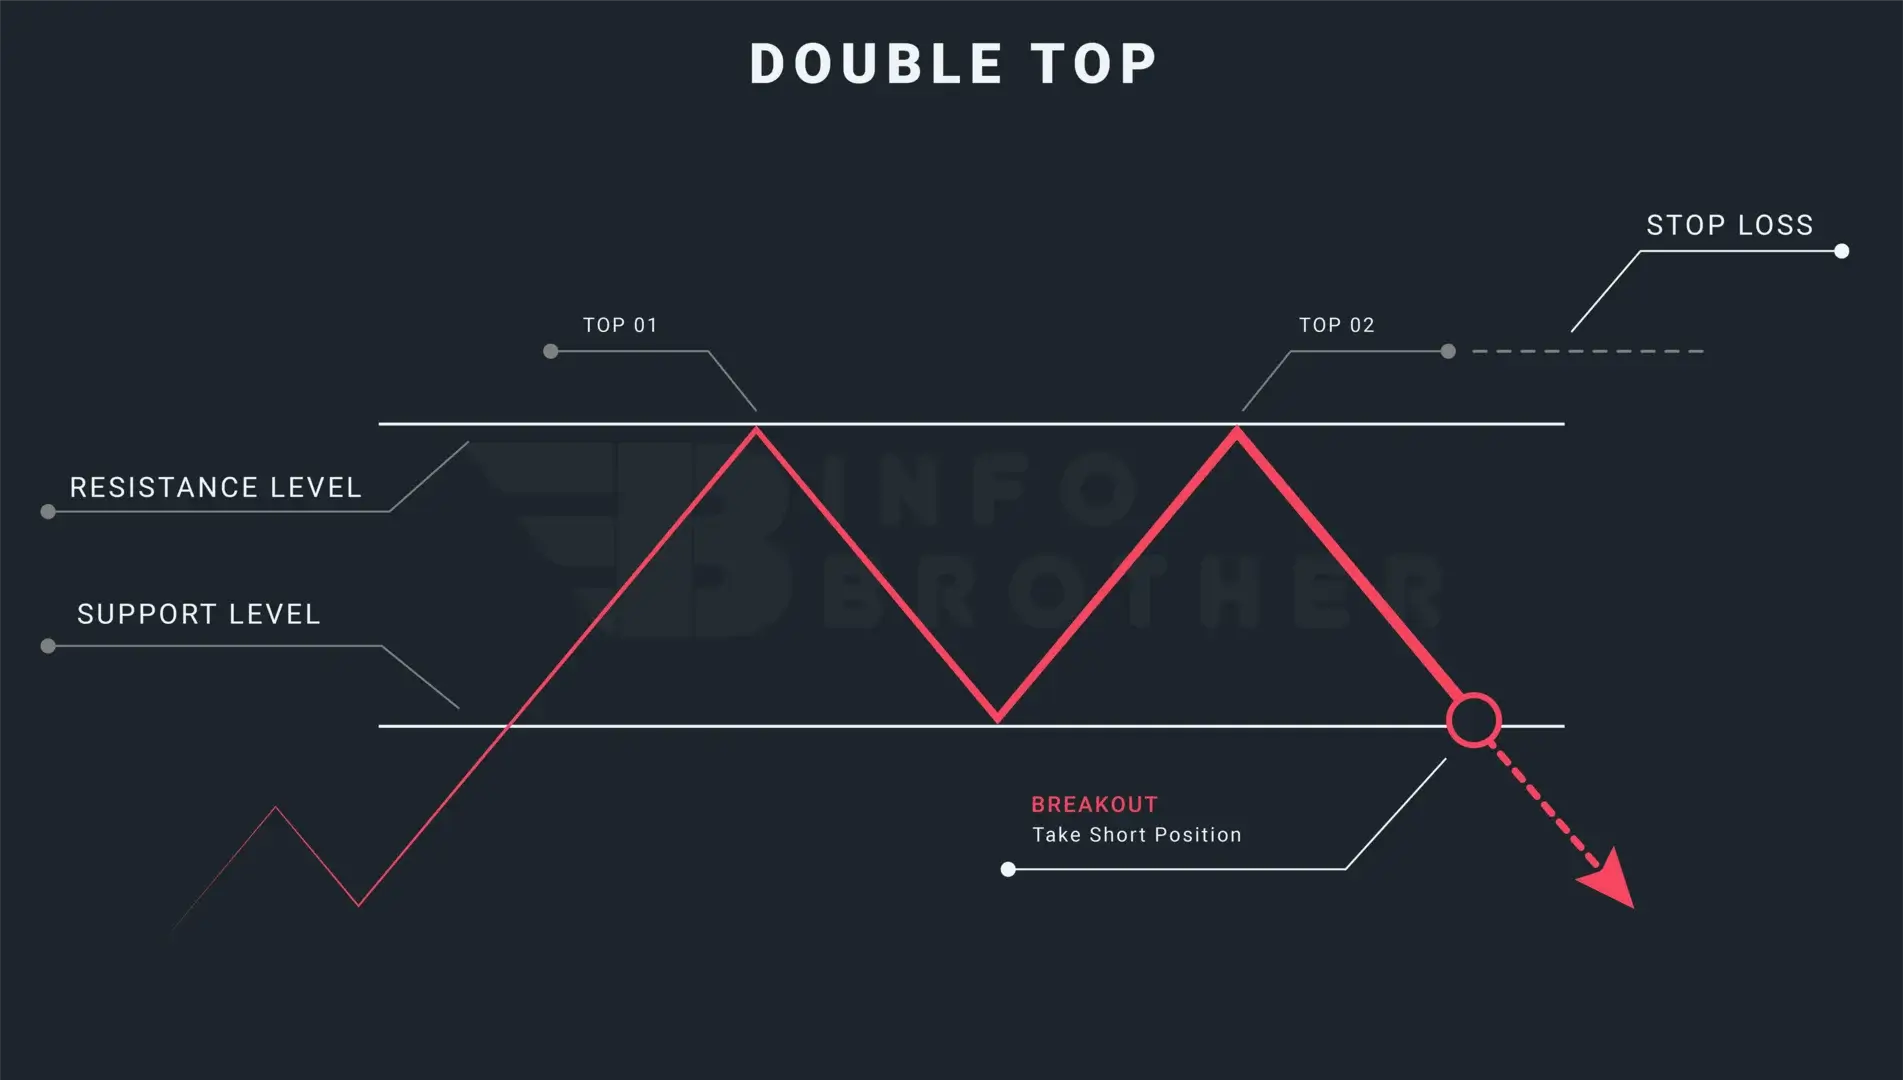
At the peak of an upward trend, a bearish reversal pattern known as the double top shows that buyers are weakening and sellers are active in the market. This pattern resembles the letter 'M' due to the twice touched high, which we view as a resistance level.
A market with a double top pattern has two high peaks, and this pattern predicts an oncoming negative reversal signal. The price will gradually fall between the two high points, with some resistance at the price peaks. The market rallies back towards the high of the first peak after partially retracing the first peak, but the market's strength is weakening and it is unable to maintain a break above the first peak.
In the opinion of the technical expert, the twice-touched highs serve as a resistance level that prevents buyers from printing a new high above the existing high, providing sellers the opportunity to push prices lower. We call this the 'double top' because it results in two highs that resemble the letter 'M.'
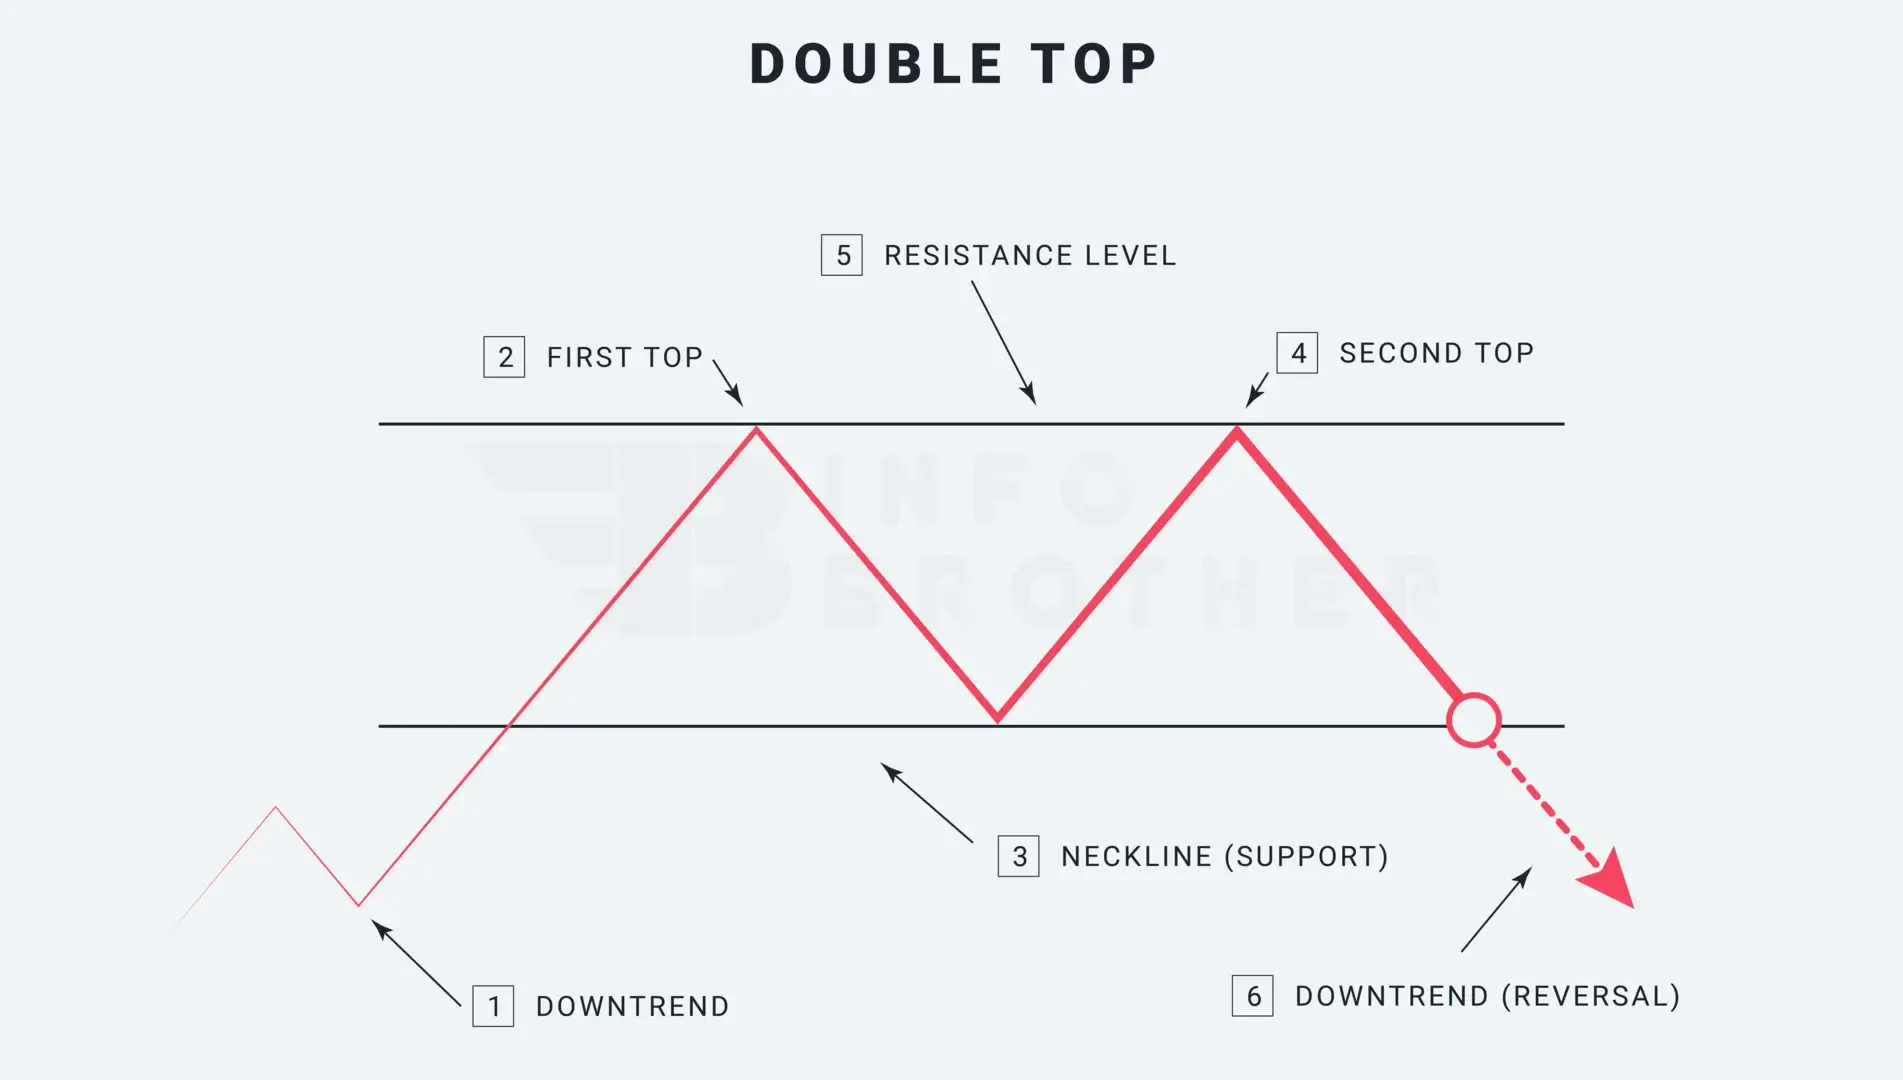
Double top chart patterns are bearish reversal patterns that appear during uptrends. This pattern is formed by two highs that rise above the support level, often known as the "neckline." Following a substantial upturn, prices first make their first high, then they fall down to the neckline support level before moving up to the level of resistance and making their second high. When the price returns to the neckline after the second high is made, this pattern will have been fully formed. Market participants enter it when the price crosses the neckline or support level.
There are six factors to think about while figuring out the pattern.
1. A upward trend:
There must be a trend that already exists in order for a reversal pattern to occur. A considerable upturn should exist in the case of a double top reversal pattern. If the trend is sideways or downward trend , the trader should avoid this pattern. The uptrend preceding this pattern is significant.
2. The First Top:
At the first high, the current trend should have achieved its peak. Consequently, the first high seems pretty normal, and the uptrend is still very much visible.
3. The Neckline
Usually, there is a decline of between 10% and 20% after the first peak. A decline, though, may indicate an early buildup. The volume of the drop from the peak is frequently negligible.
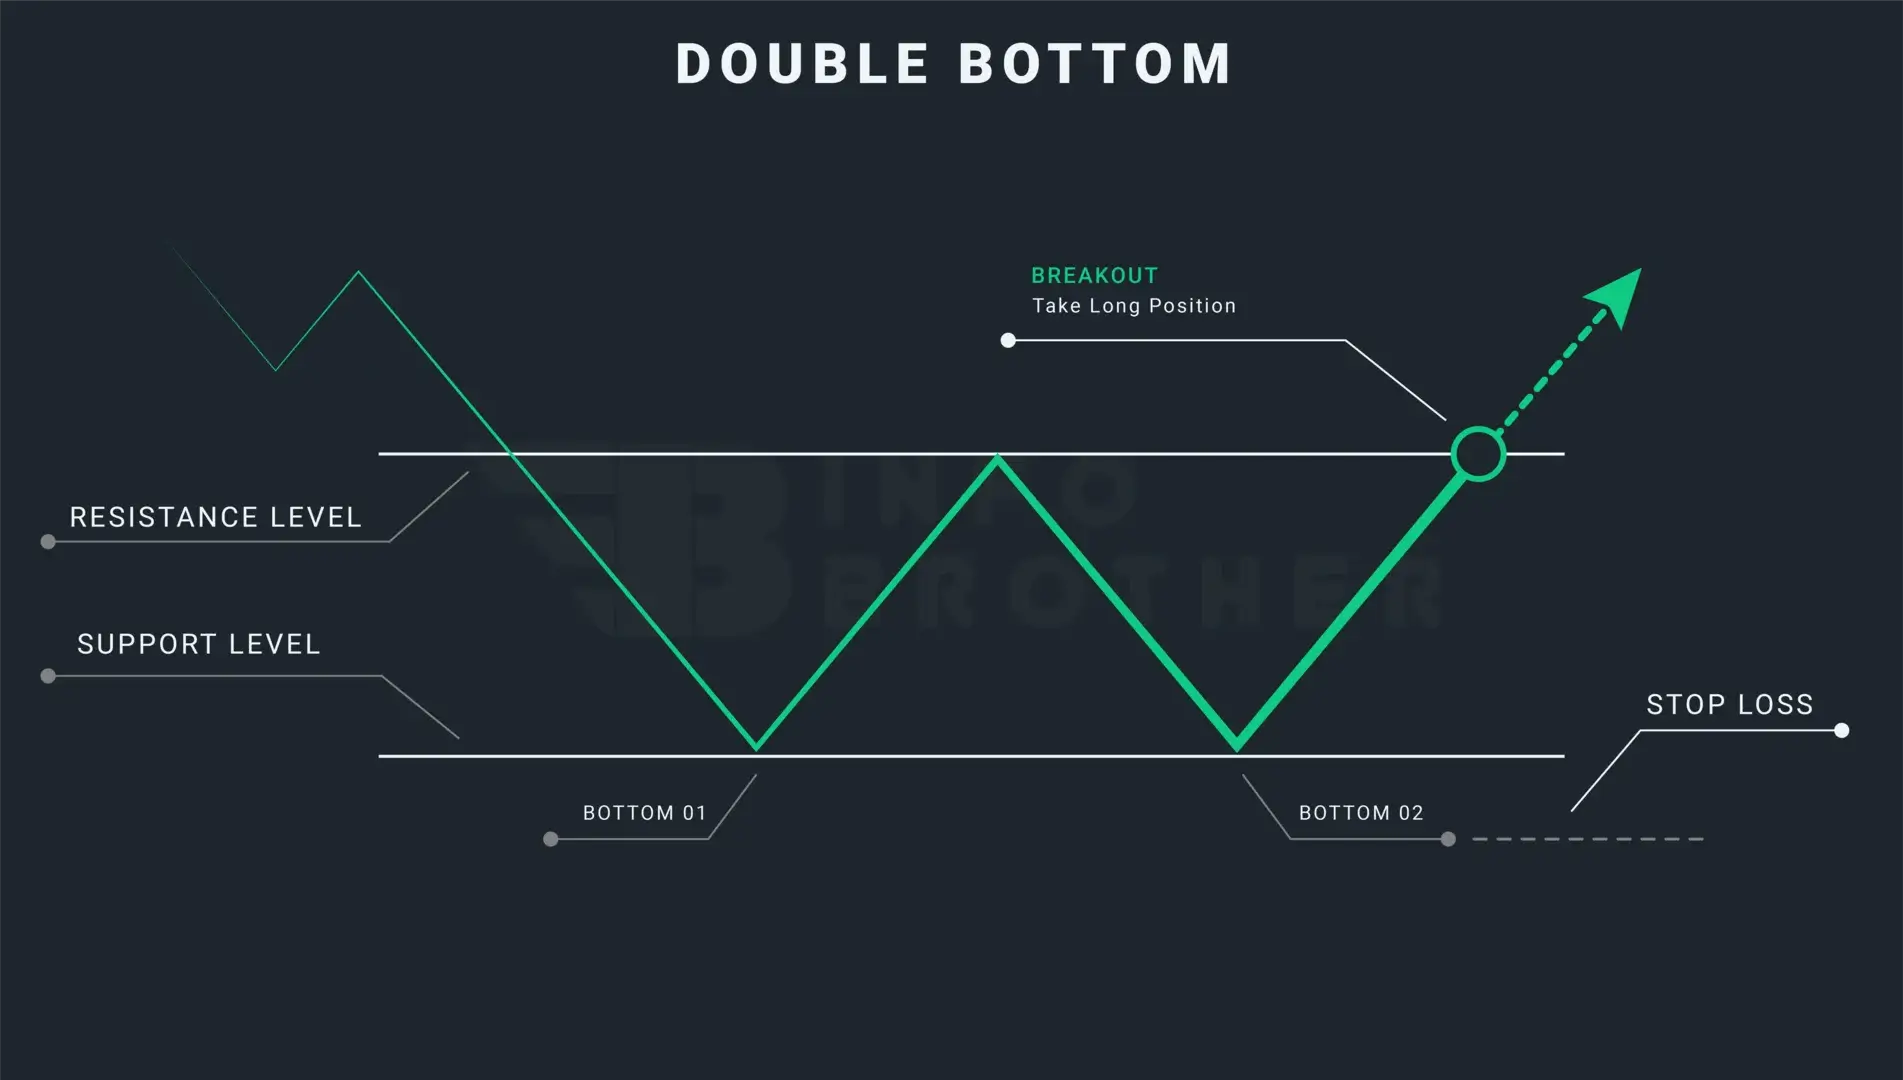
The Difference Between Double top and a Double Bottom:
Although they each seem distinct, these patterns are both reversal patterns. A double top that resembles the letter "W" signals a bullish turn. while, the letter 'M' indicates for a double top pattern
Read More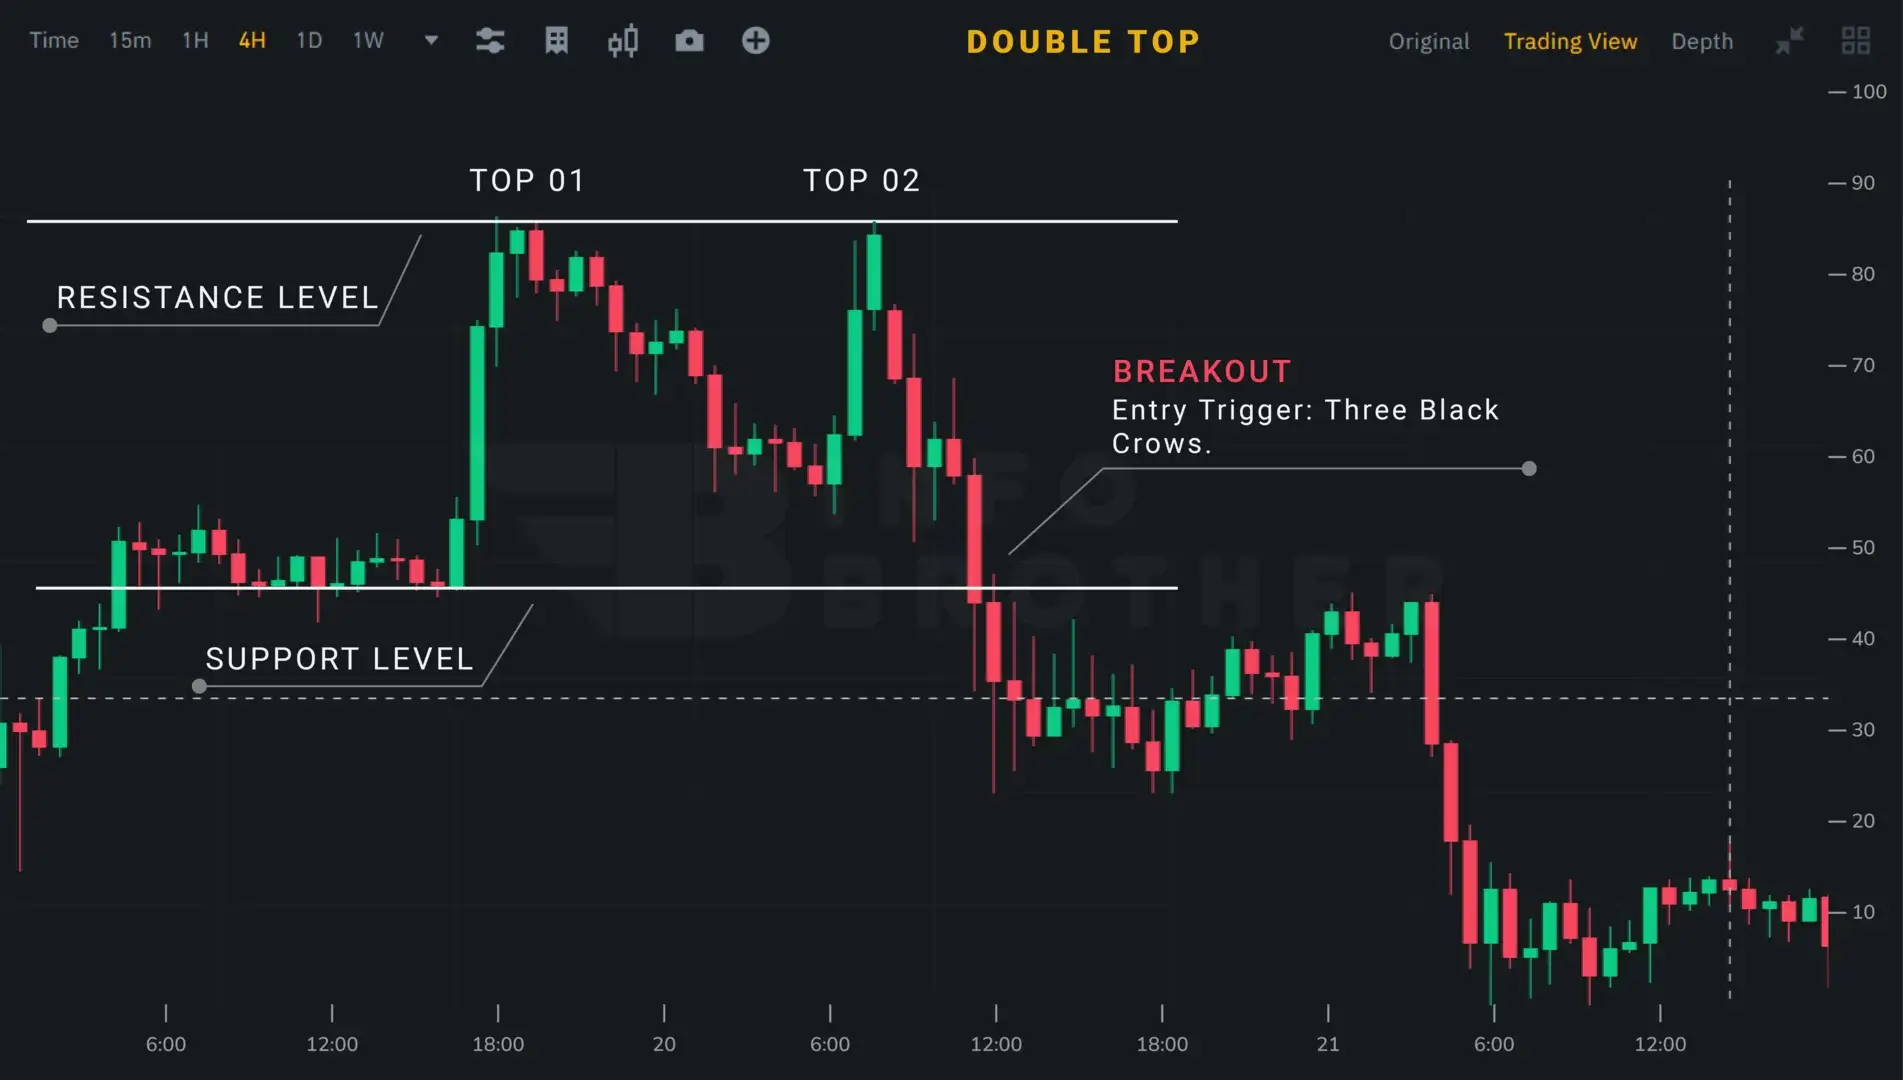
Since double tops are reversal patterns, traders should confirm an upward trend in the market before entering a position. If the market is trending sideways or downward, a trader should avoid this pattern.
- Take a short position just when the price crosses through the neckline or support zone.
- The stop-loss should be placed at the second top of the pattern.
- The neckline to top measurement should be the same as the price goal.
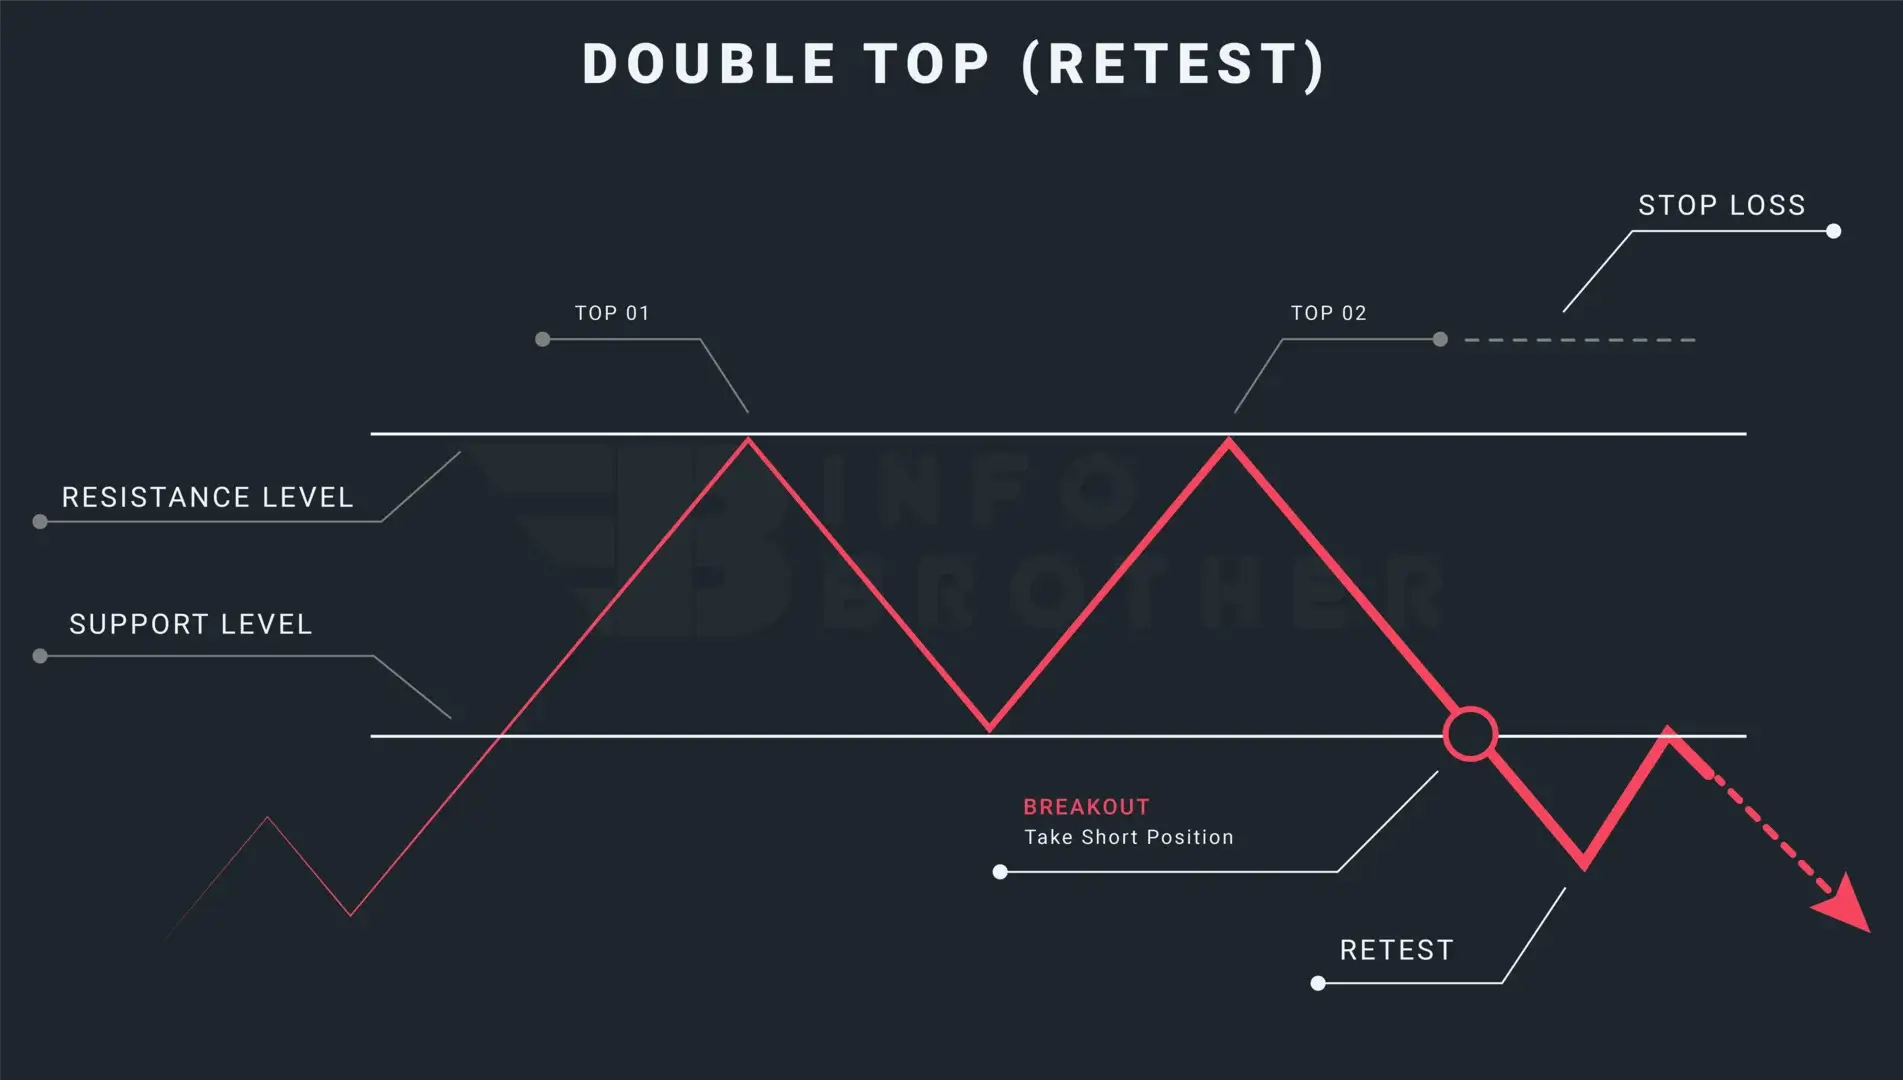
Retesting is the act of bringing a price back to a level that the market has previously breached. A retest, which happens when the price breaks through the trendline and returns to retest the resistance or support level that was just crossed, may be used by traders to prevent false breakouts.
