Head and shoulder patterns, often known as 'head and shoulder tops,' are bearish reversal patterns that appear during market uptrends. This pattern is comparable to the inverse head and shoulders pattern, except it is inverted, and it typically indicates a trend and market attitude shift.
The head and shoulders pattern is a popular bearish reversal indicator pattern that indicates a price reversal from an upward trend. This pattern features three successive crests, the highest of which is in the centre and is known as the 'head,' while the outside two are known as the 'shoulders.' Both sides' shoulders should be the same height and breadth.
Theory:
According to the theory behind this pattern, prices decrease with great volume from the initial high until the left shoulder formation is complete, at which time prices rise to the new high. The head formation is completed by a price decrease with slightly higher volume than previously witnessed. A corrective reaction on low volume leads to the right shoulder forming, followed by a fast move down on higher volume, which breaches the neckline once more.
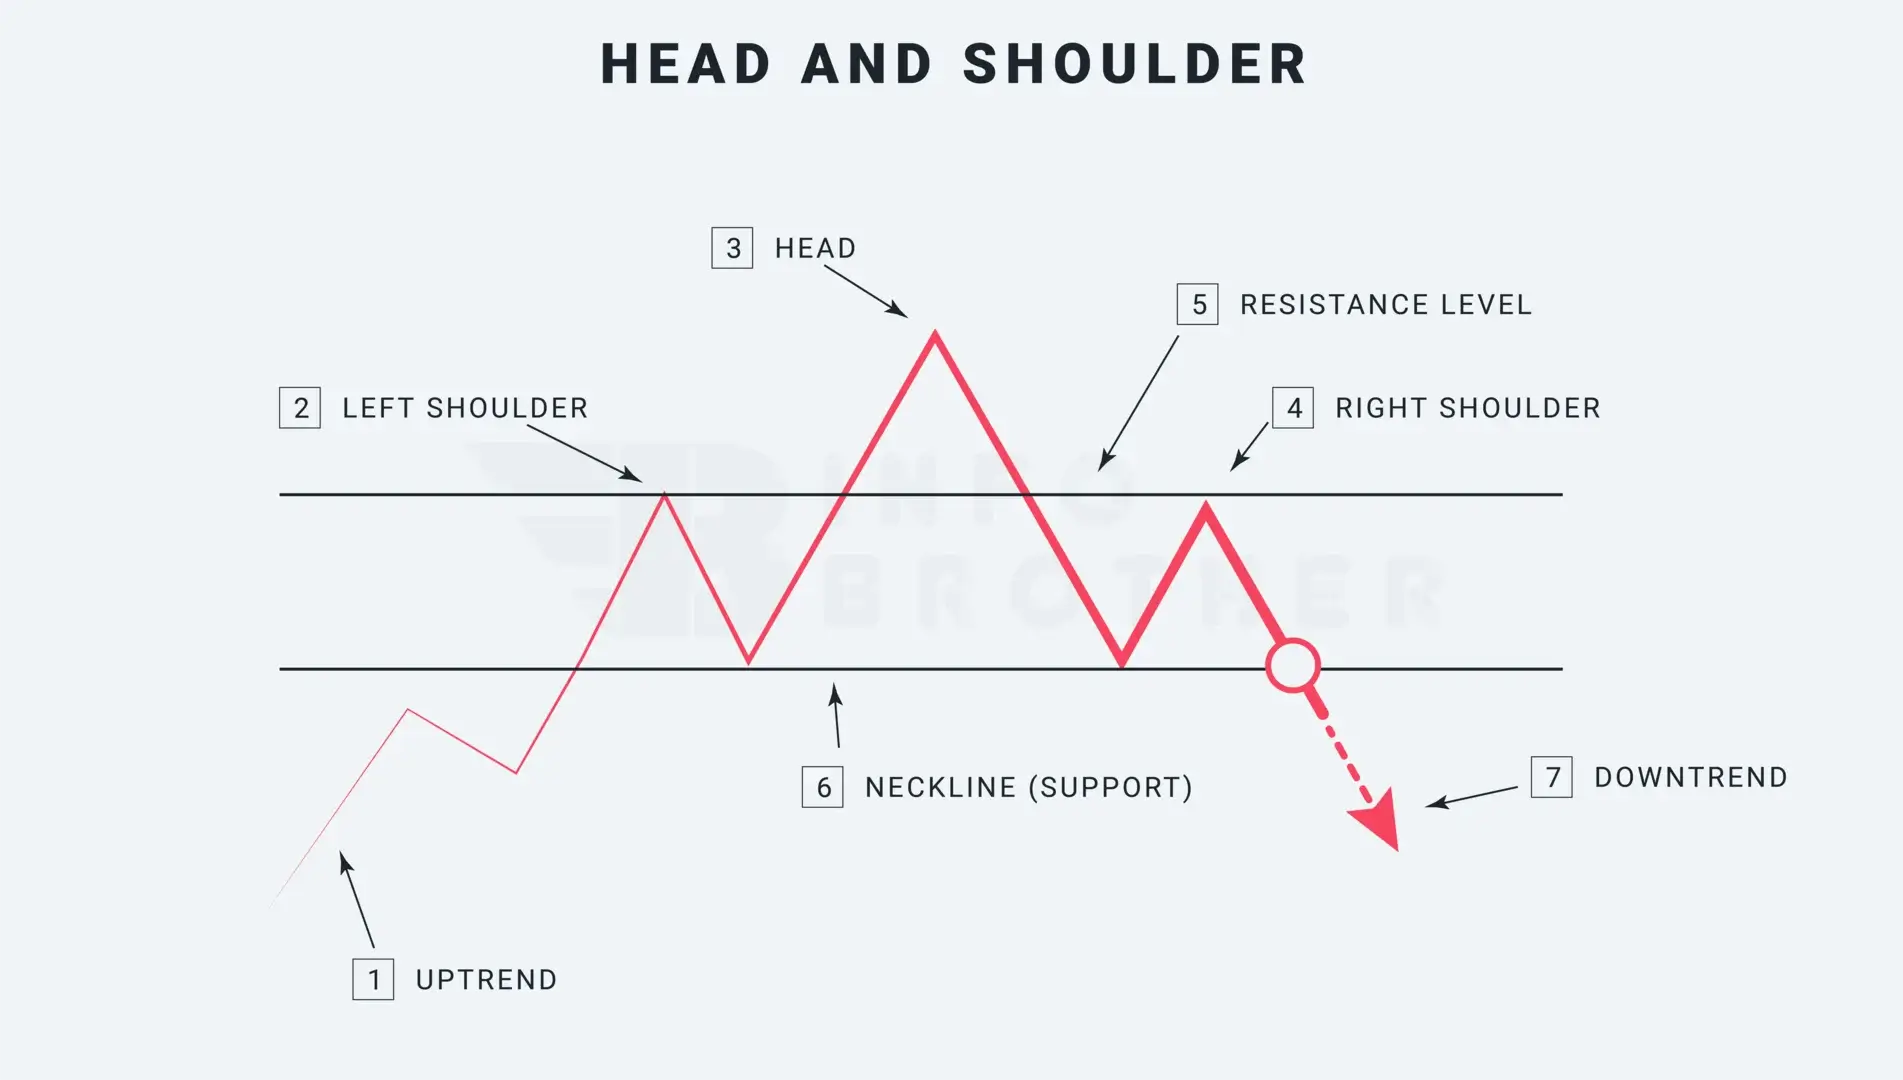
Following an upward turn, a head and shoulders pattern, also known as a head and shoulder top, forms, signalling a trend change. The following characteristics are essential for the creation of the head and shoulders: The price rises to a crest known as the left shoulder, drops, rises above the former crest known as the head, drops again, and eventually rises to the next crest known as the right shoulder, but not all the way to the second crest, or the head. After the last crest is established, the price falls toward the support level around the bottom of the previous crest.
There are seven factors to consider while determining the Head and shoulder pattern.
1. A Upward trend:
A head and shoulder pattern is a reversal pattern, and reversal patterns may occur only when there is already a trend. In the case of a head and shoulders pattern, there should be a considerable upward turn.
2. Left Shoulder:
In an uptrending market, the left shoulder forms a crest that marks a new trend high. Once this crest is established, prices will decrease to complete the formation of the left shoulder.
3. Head
A climb that exceeds the previous high and establishes the new highest point of the head begins at the left shoulder's low. To complete the head formation, the price drops again after hitting the top and travels back toward the previous support level, or neckline.
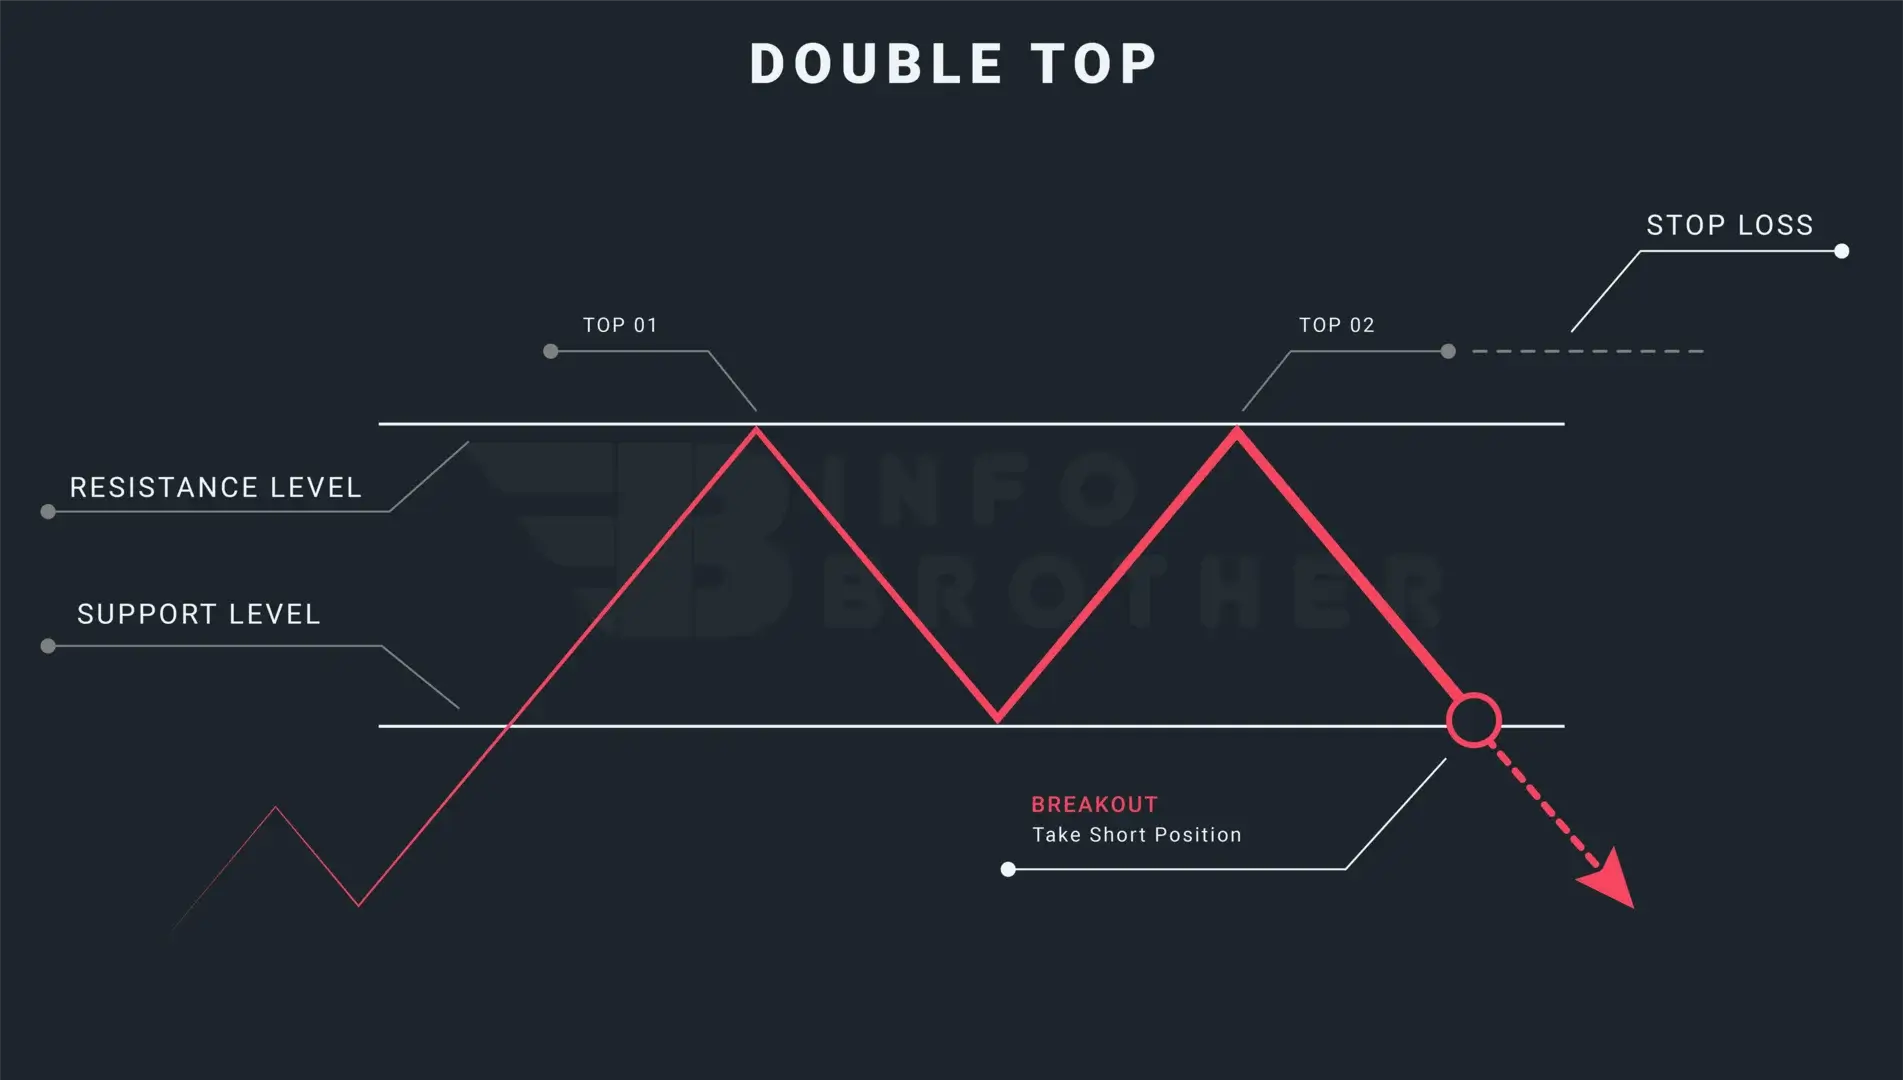
The Difference Between Head and shoulder and double top pattern:
A bearish reversal pattern known as the double top pattern can be spotted near the top of an upward trend. Because it twice reached the high, which we regard as a resistance level, this pattern resembles the letter 'M.'...
Read More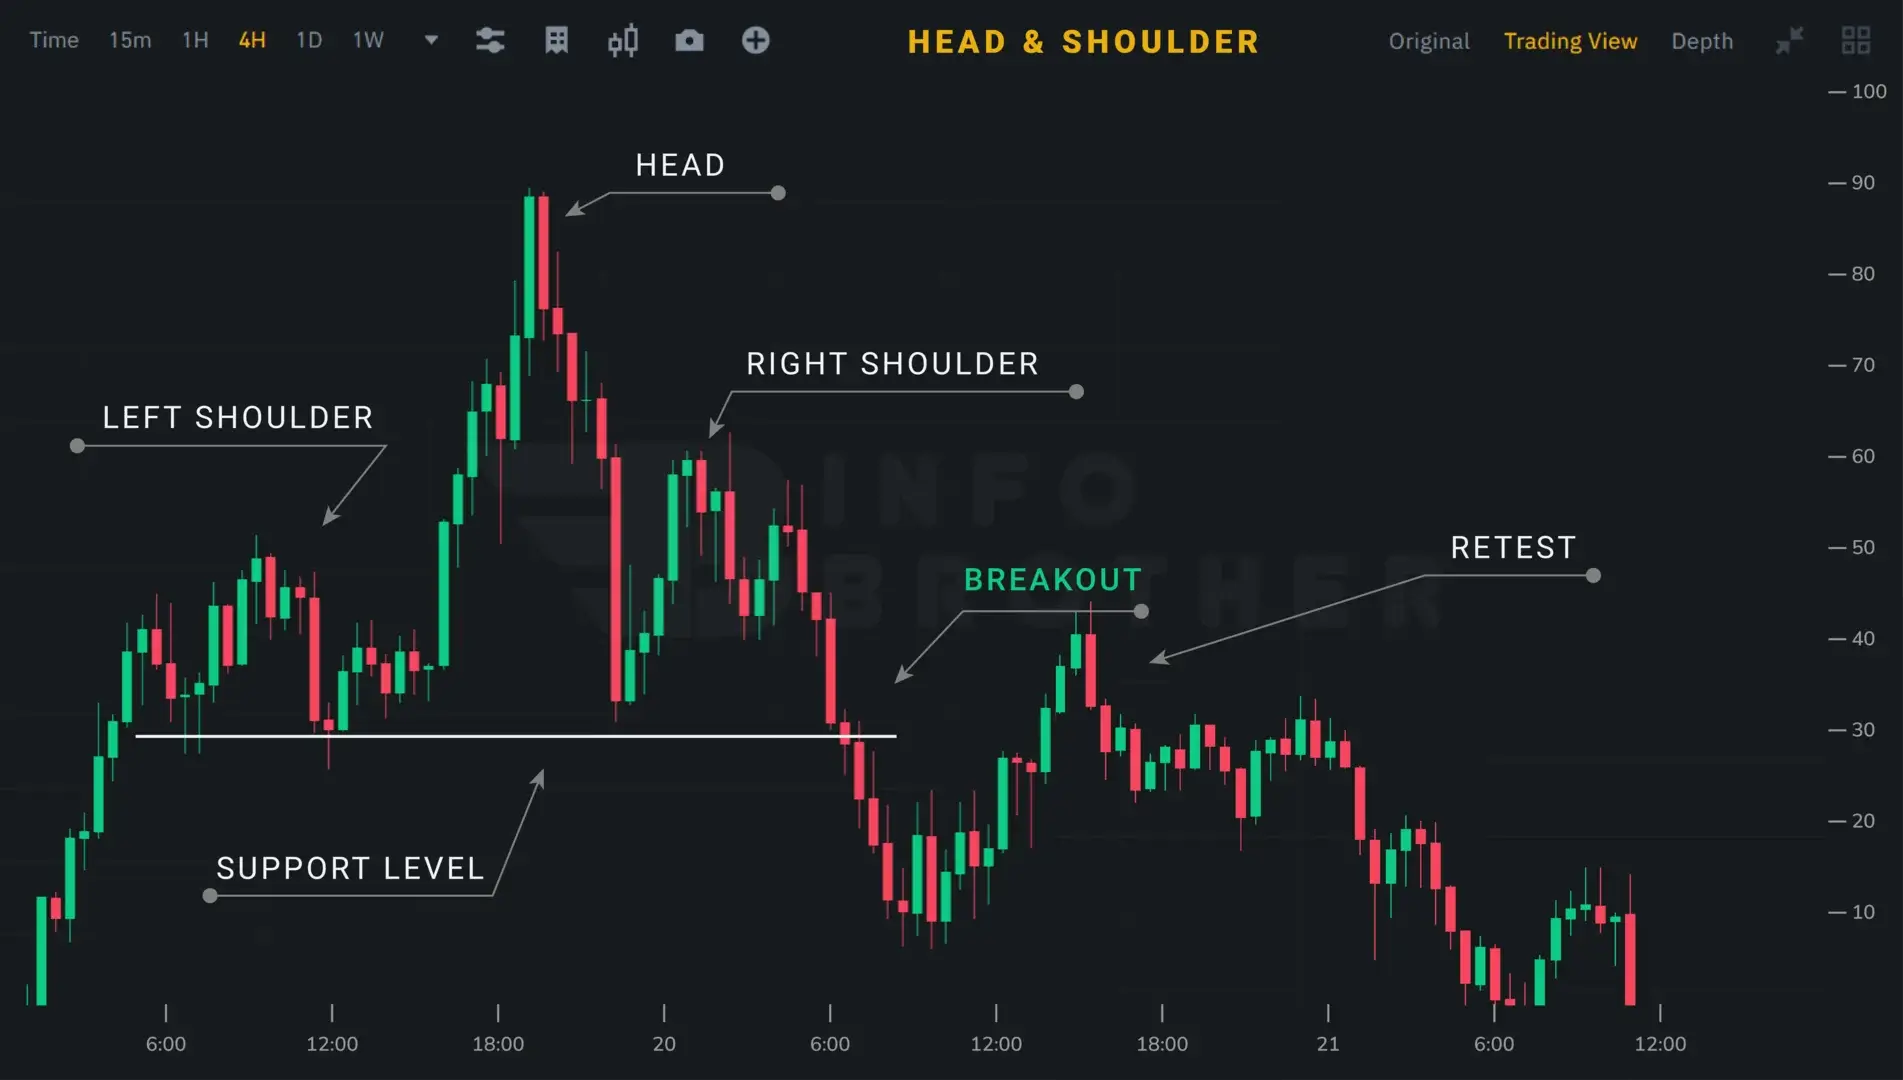
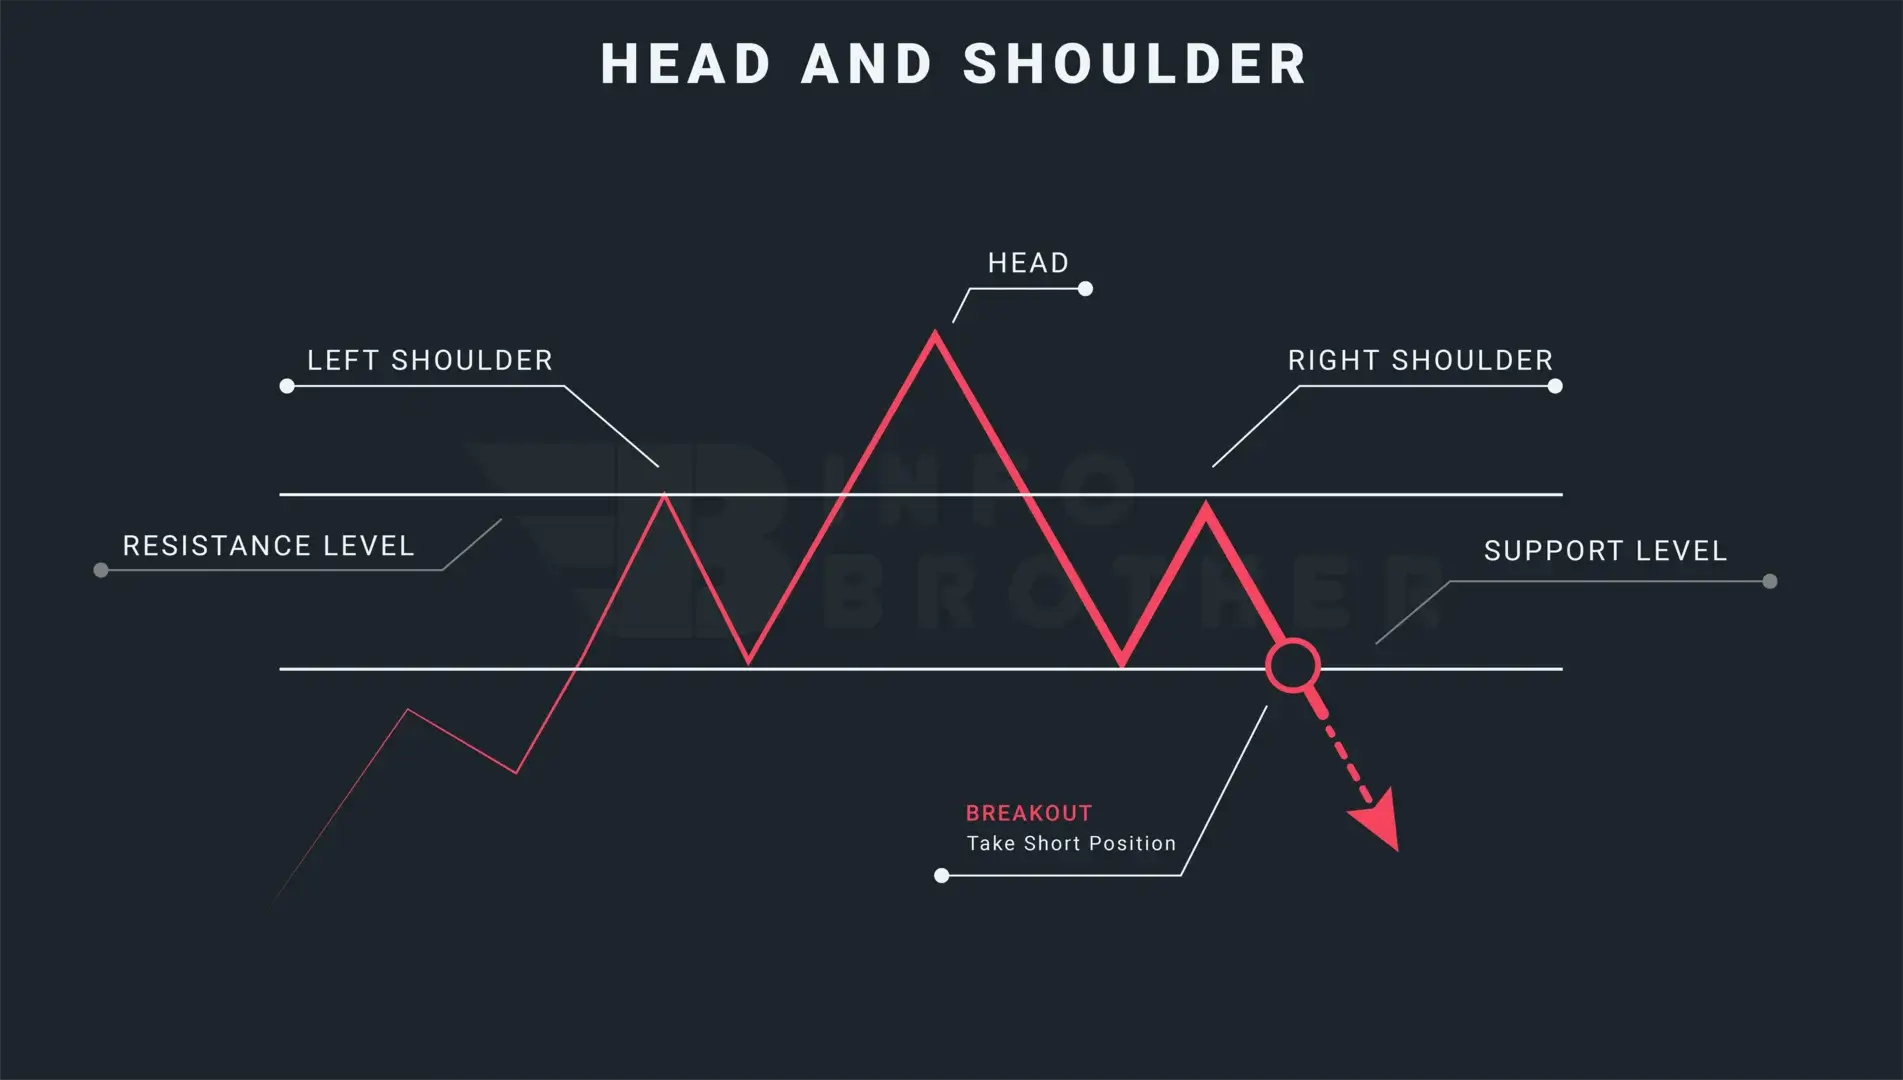
The head and shoulders pattern occurs in an ascending trend, signalling a shift in emotion from bullish to bearish. When a price peak is achieved, it falls briefly before rising again—this time more sharply—before dipping and rising one last time.
Traders enter a short position when prices begin to fall again and break through the neckline, or support level. Successful traders look for a large candle in volume to confirm the accuracy of the breakout.
- A stop-loss order might be placed directly above the broken neckline or level of support.
- By determining the distance between the pattern's neckline and the top of the head, the profet target may be established by setting the target at that same distance from the neckline in the breakout direction.
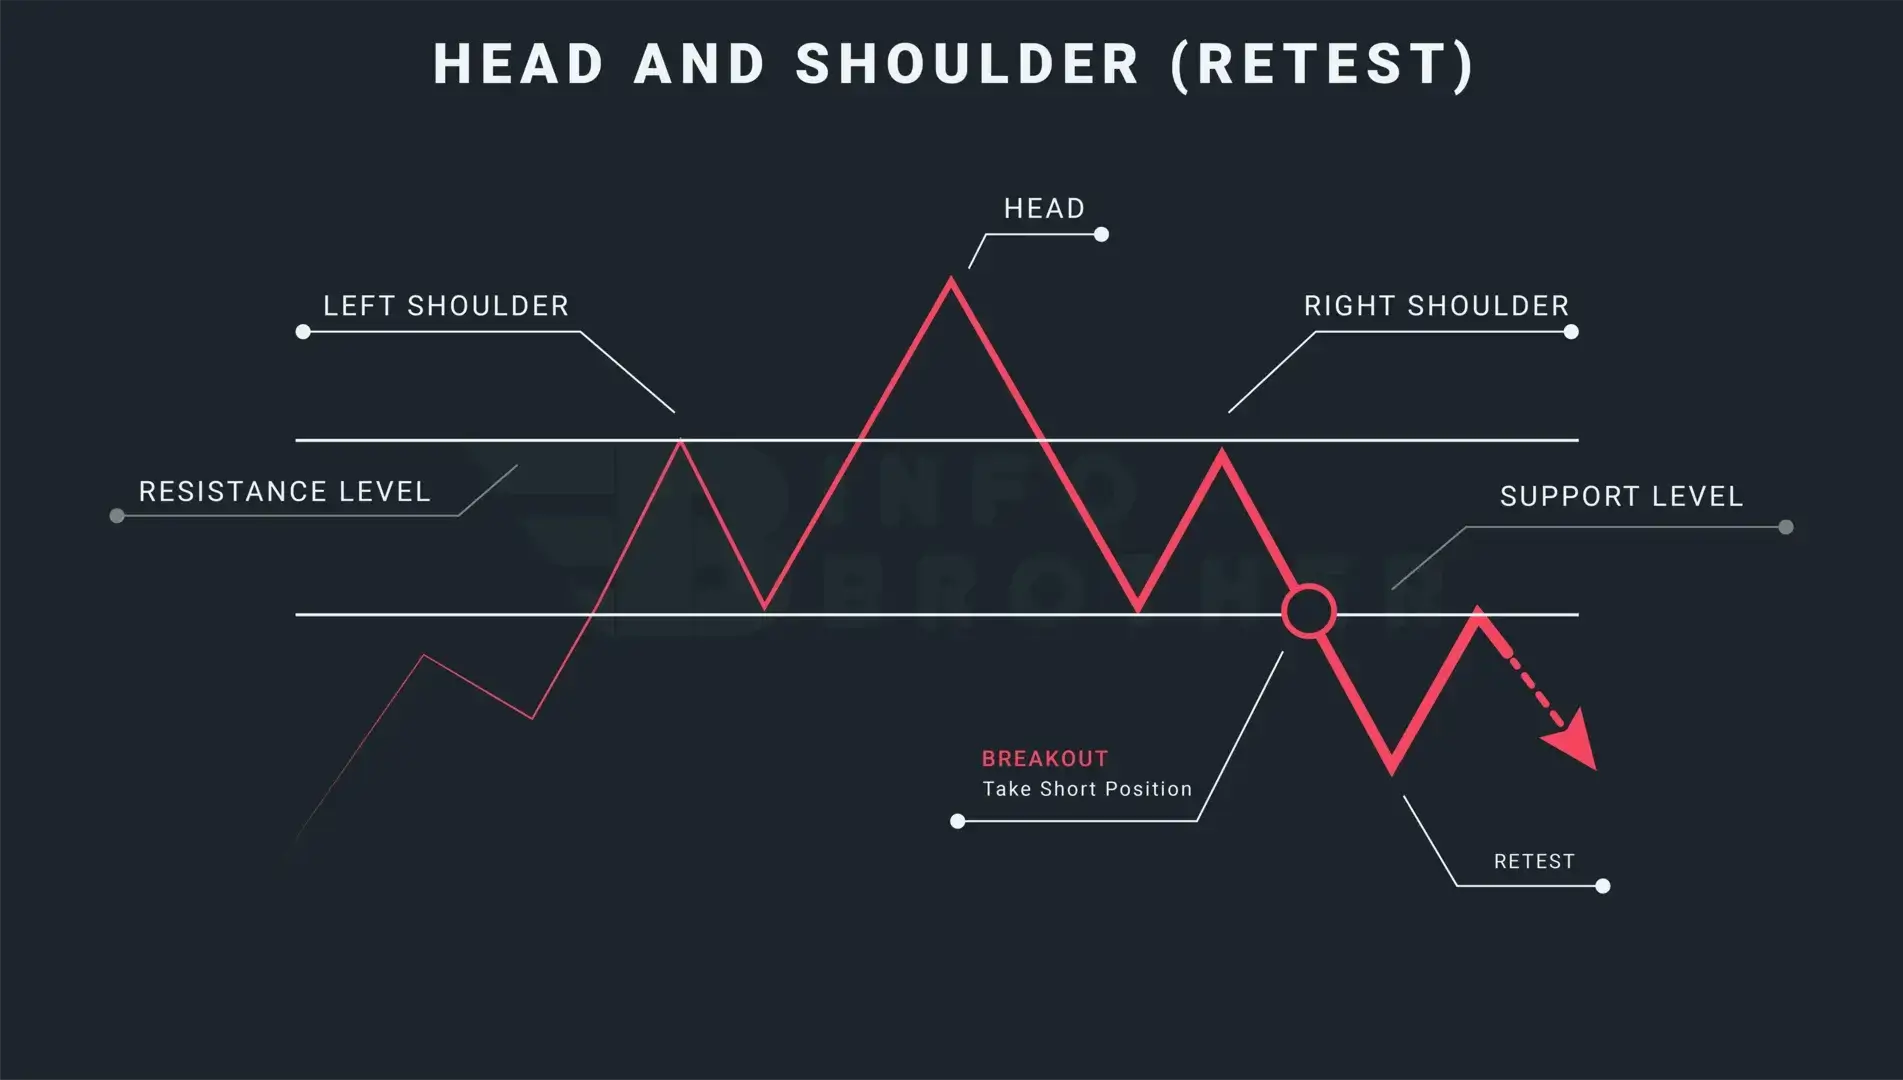
Bringing a price back to a level that the market has already crossed over is known as retesting. Traders may employ a retest to stop false breakouts. A retest occurs when the price crosses the trendline and then reverses direction to retest the resistance or support level that was just crossed.
