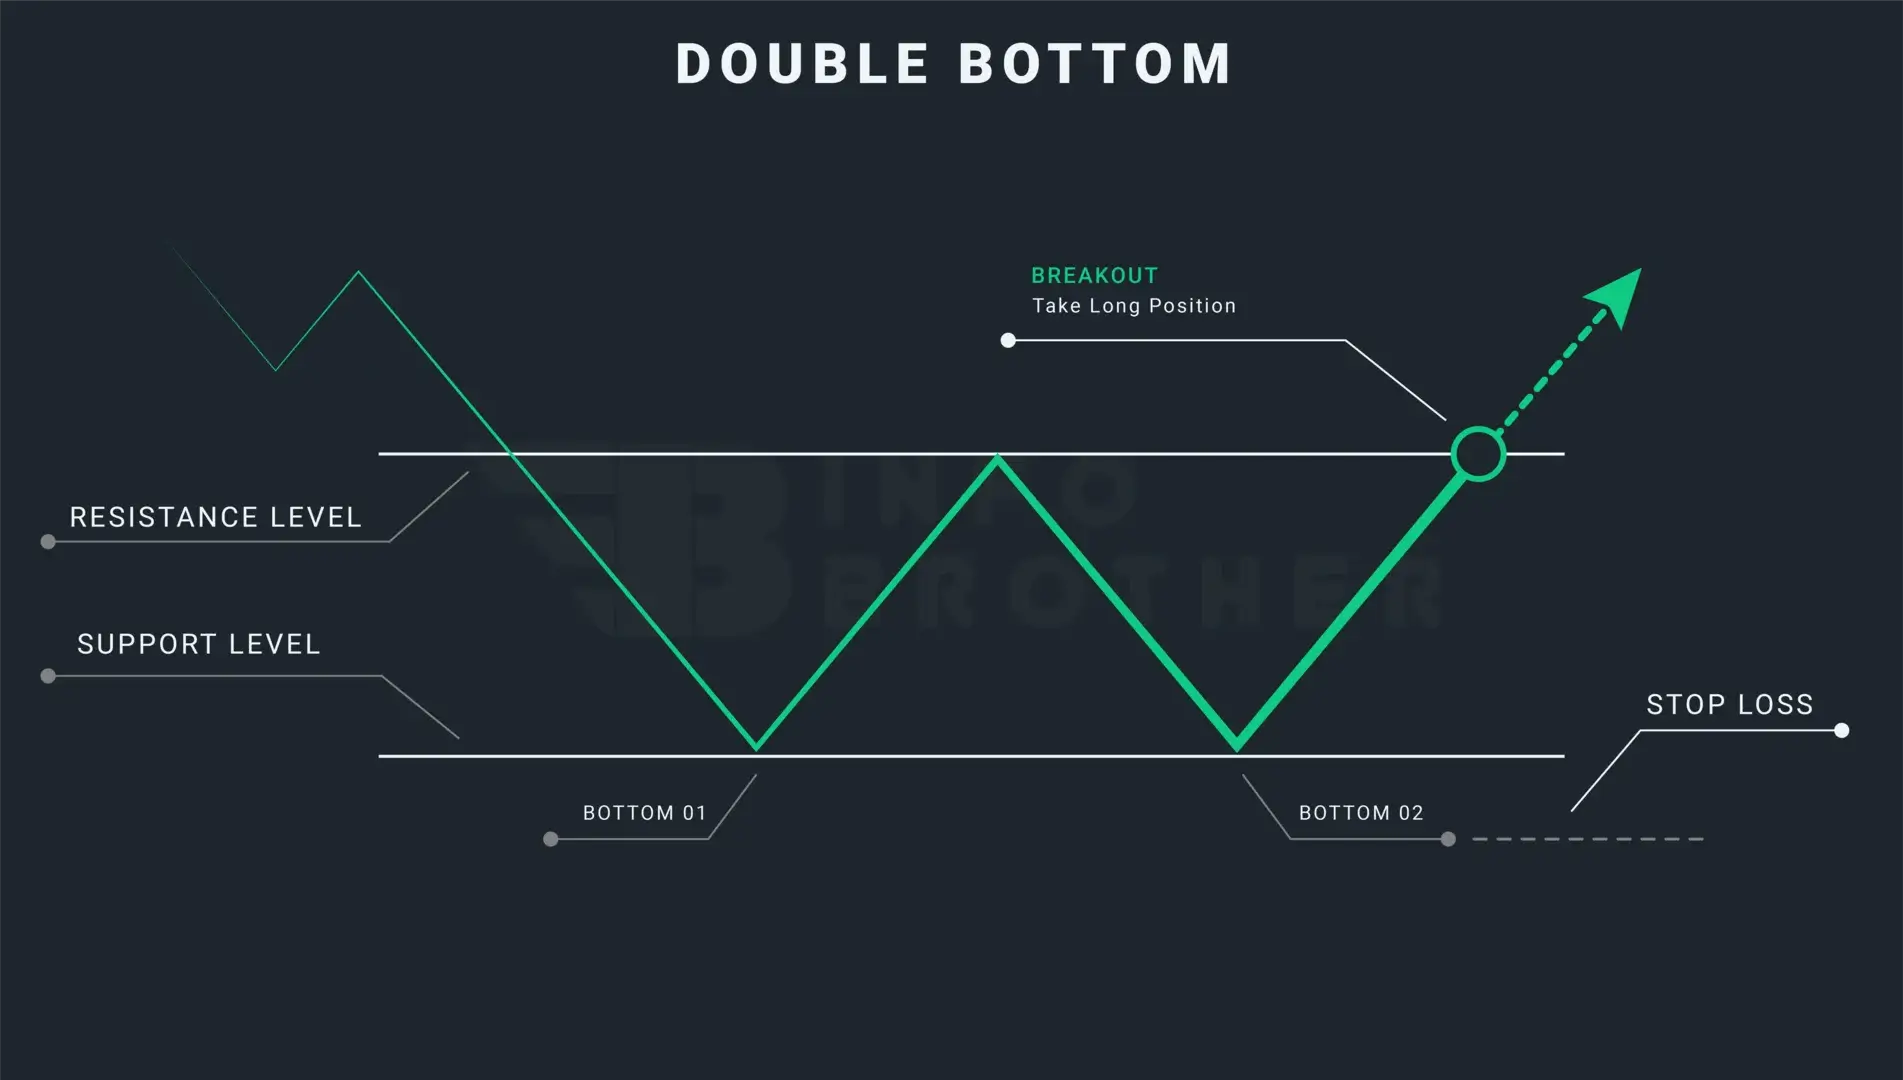
The double bottom pattern is a bullish reversal pattern that appears at the bottom of a downtrend and indicates that buyers are gaining strength while sellers are losing momentum. Because of the twice touched low, which we consider to be a support level, this pattern resembles the letter 'W.'
A double bottom is a pattern that indicates a gradual shift from past leading price action. It is seen near the end of a downtrend. The price action prints lower highs and lower lows as it travels down, then rises and moves back down to retest the prior low.
According to the technical expert, the twice-touched lows act as a support level and prevent sellers from printing a new low below the old bottom, giving buyers the chance to drive prices upward. As a result, we have two lows that resemble the letter 'W,' which we refer to as the 'double bottom.'
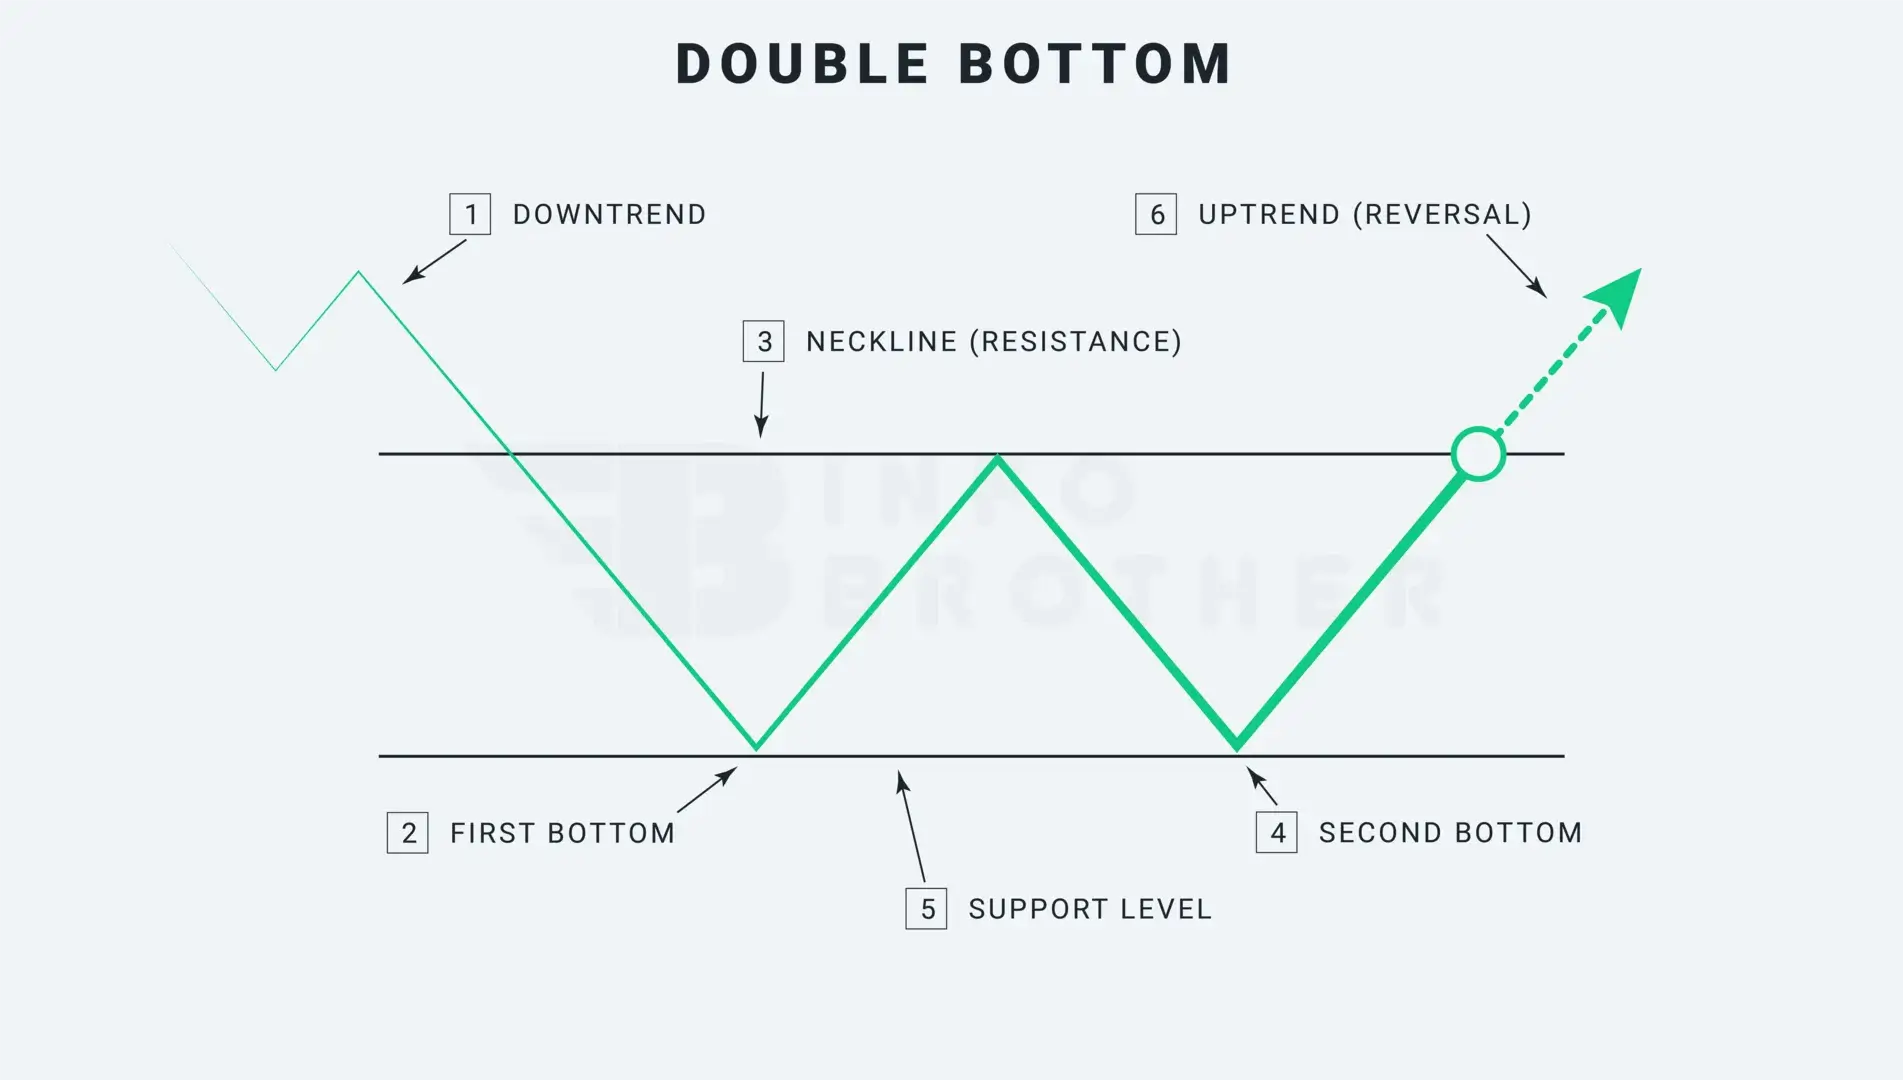
In a downtrend, a double bottom chart pattern is a bullish reversal pattern. Two lows below the resistance level, sometimes referred to as the 'neckline,'' create this pattern. After the first low is made following a significant downturn, prices bounce back to the neckline resistance level before dropping to the level of support and creating the second low. The construction of this pattern will be complete when the price moves back to the neckline following the creation of the second low. When the price breaks through the neckline or resistance level, traders join the market.
There are six factors to think about while figuring out the pattern.
1. A downward trend:
There must be a trend that already exists in order for a reversal pattern to occur. A considerable downturn should exist in the case of a double bottom reversal pattern. If the trend is sideways or uptrend , the trader should avoid this pattern. The downtrend preceding this pattern is significant.
2. The First Bottom:
The present trend should have reached its lowest point at the initial low. As a result, the initial low appears rather average, and the downtrend is still clearly present.
3. The Neckline
After the initial low, there usually follows an increase of between 10% and 20%. However, a rise might indicate early accumulation. The volume of the advance from the initial low is often insignificant.
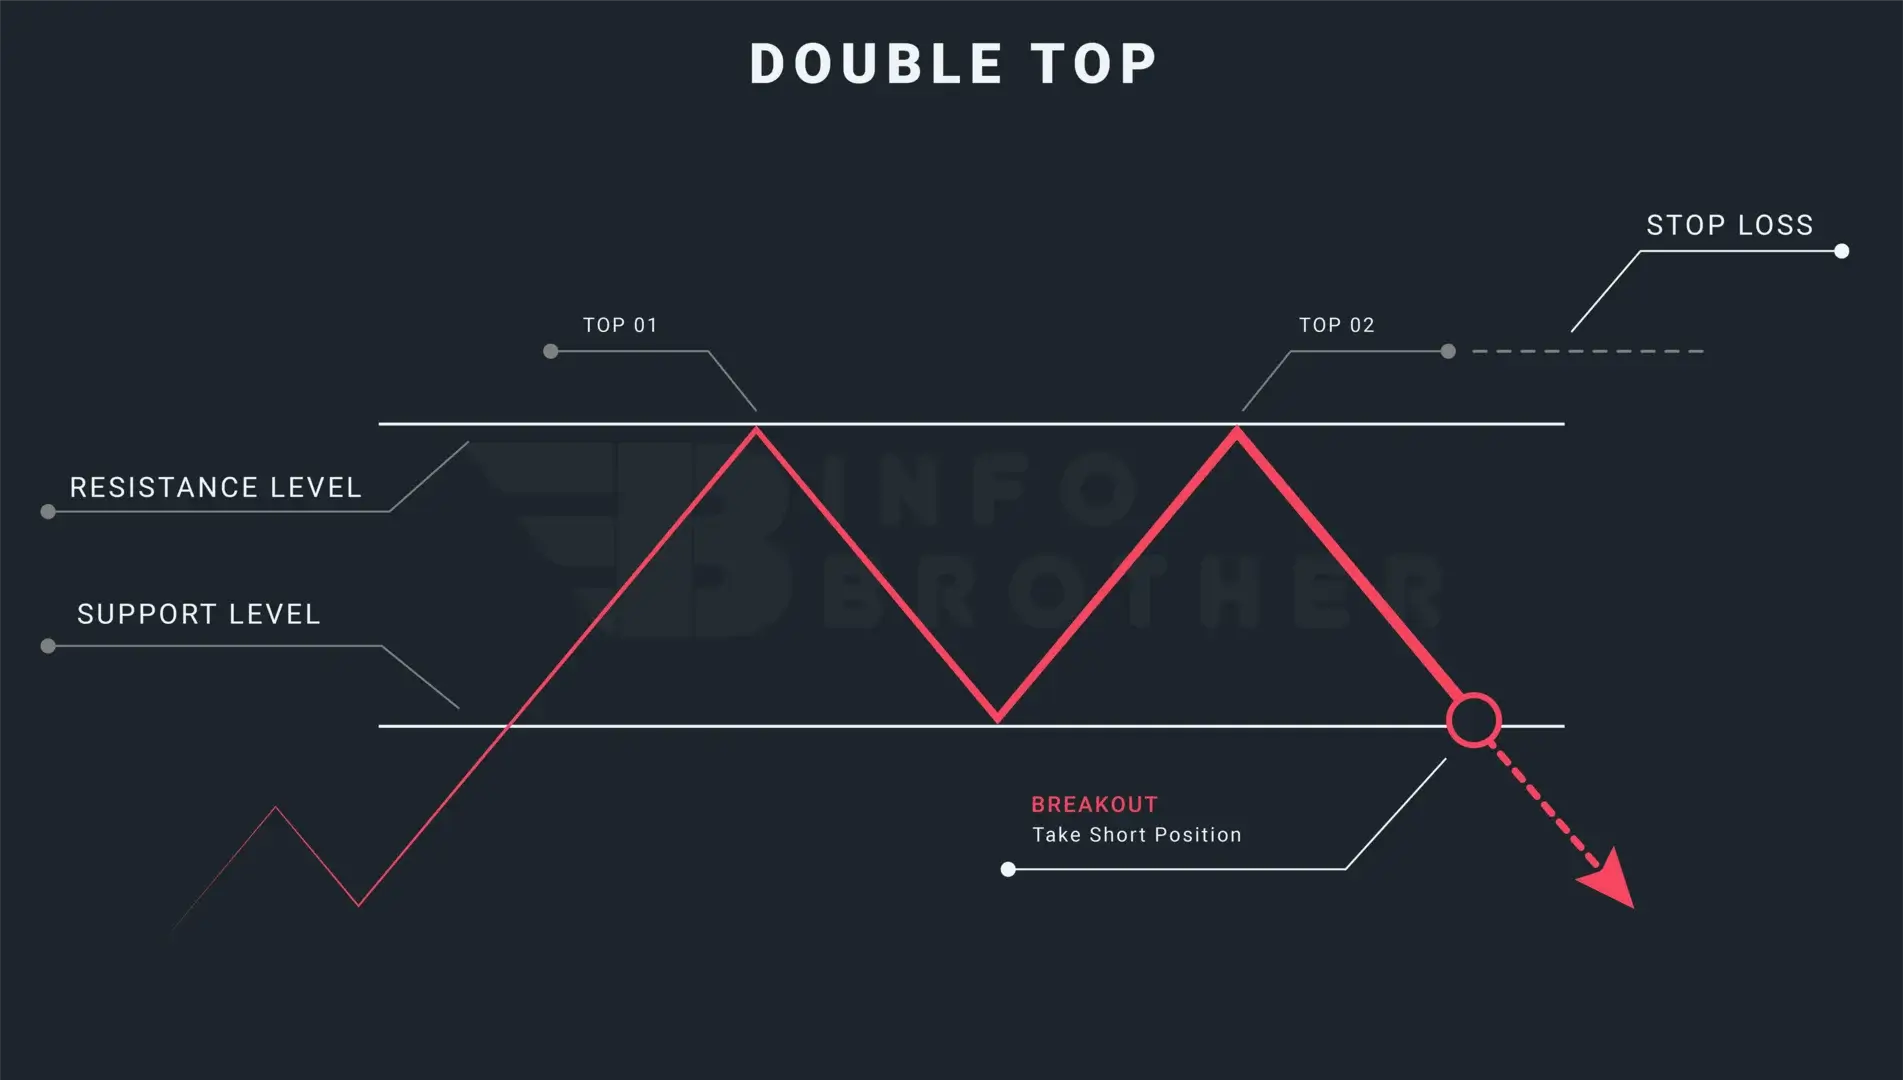
The Difference Between Double Bottom and a Double Top:
Although they each seem distinct, these patterns are both reversal patterns. A double bottom that resembles the letter "W" signals a bullish turn. while, the letter 'M' indicates for a double top pattern
Read More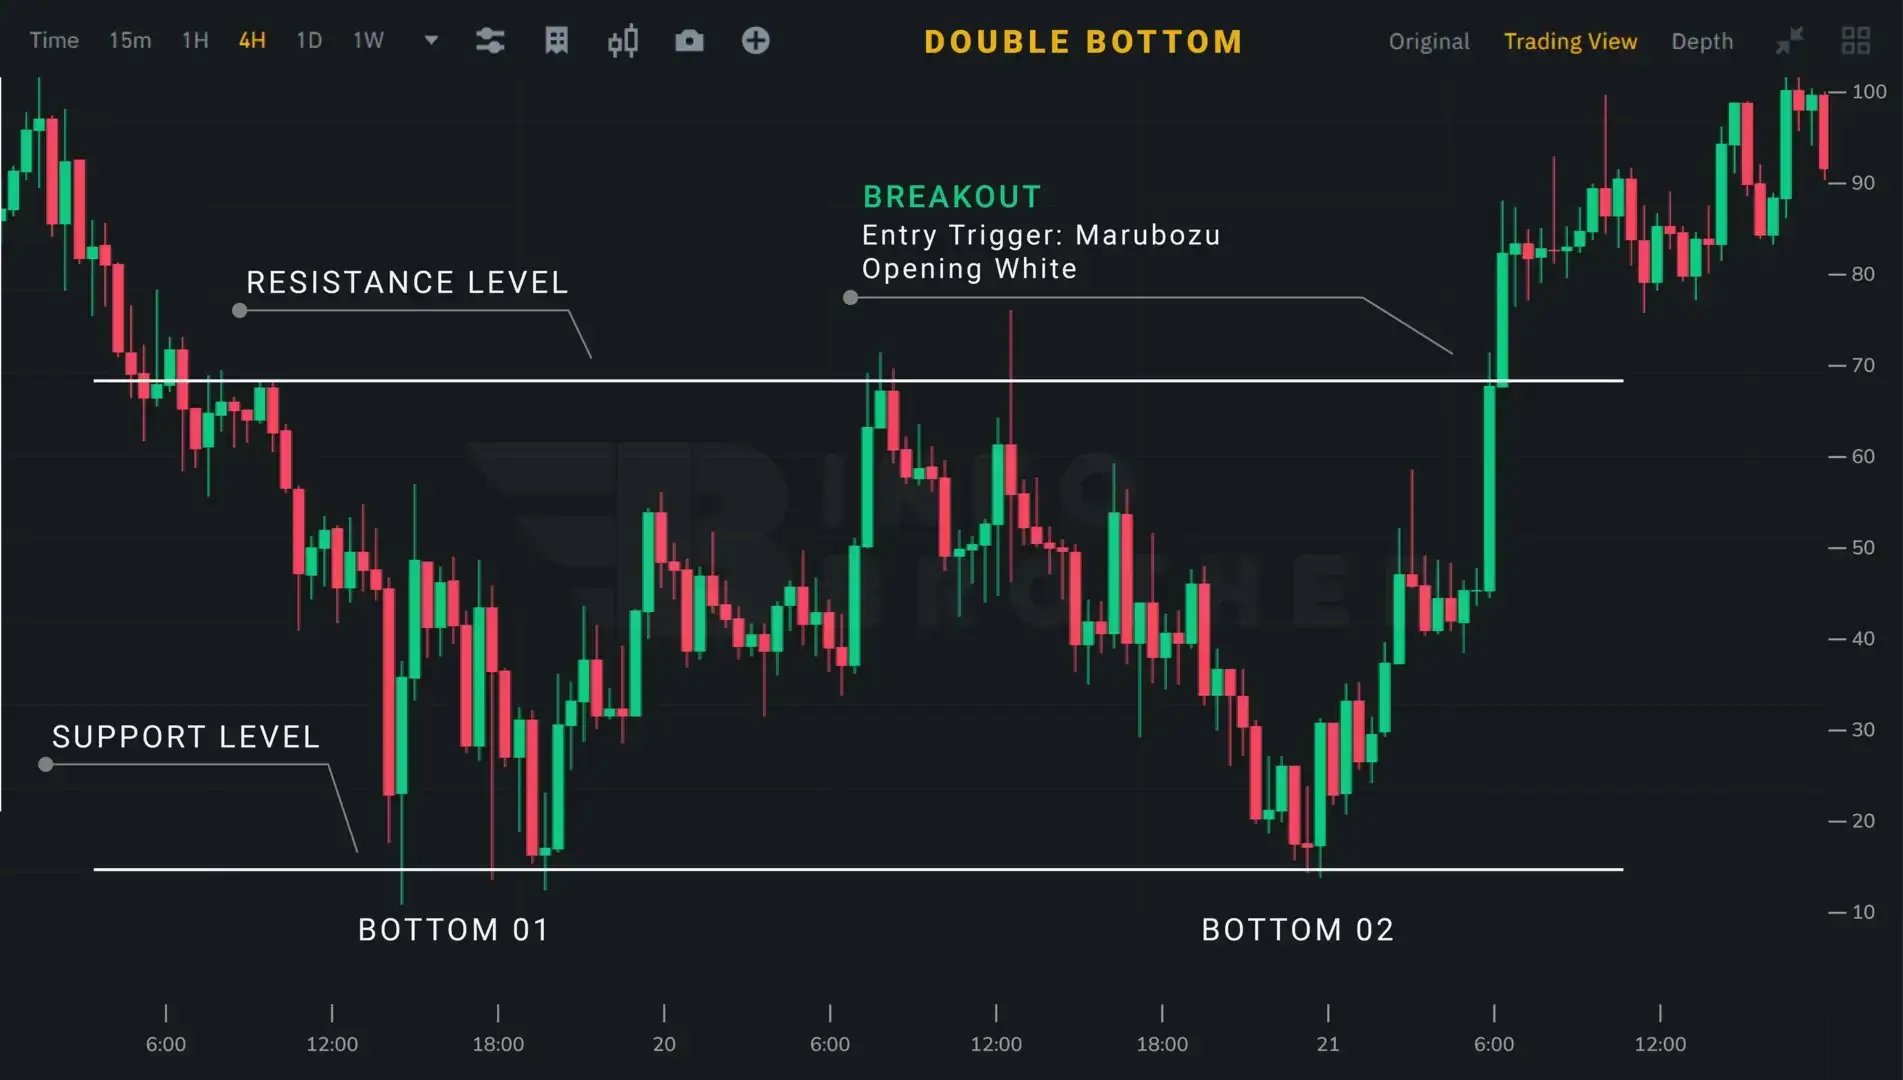
Double bottoms are reversal patterns, so traders should make sure the market is downtrending before trading. A trader should stay away from this pattern if the market is moving sideways or upward.
- Only take a long position when the price breaches the neckline or the resistance level.
- The second bottom of the pattern is where the stop-loss should be put.
- The neckline to bottom measurement should be the same as the price goal.
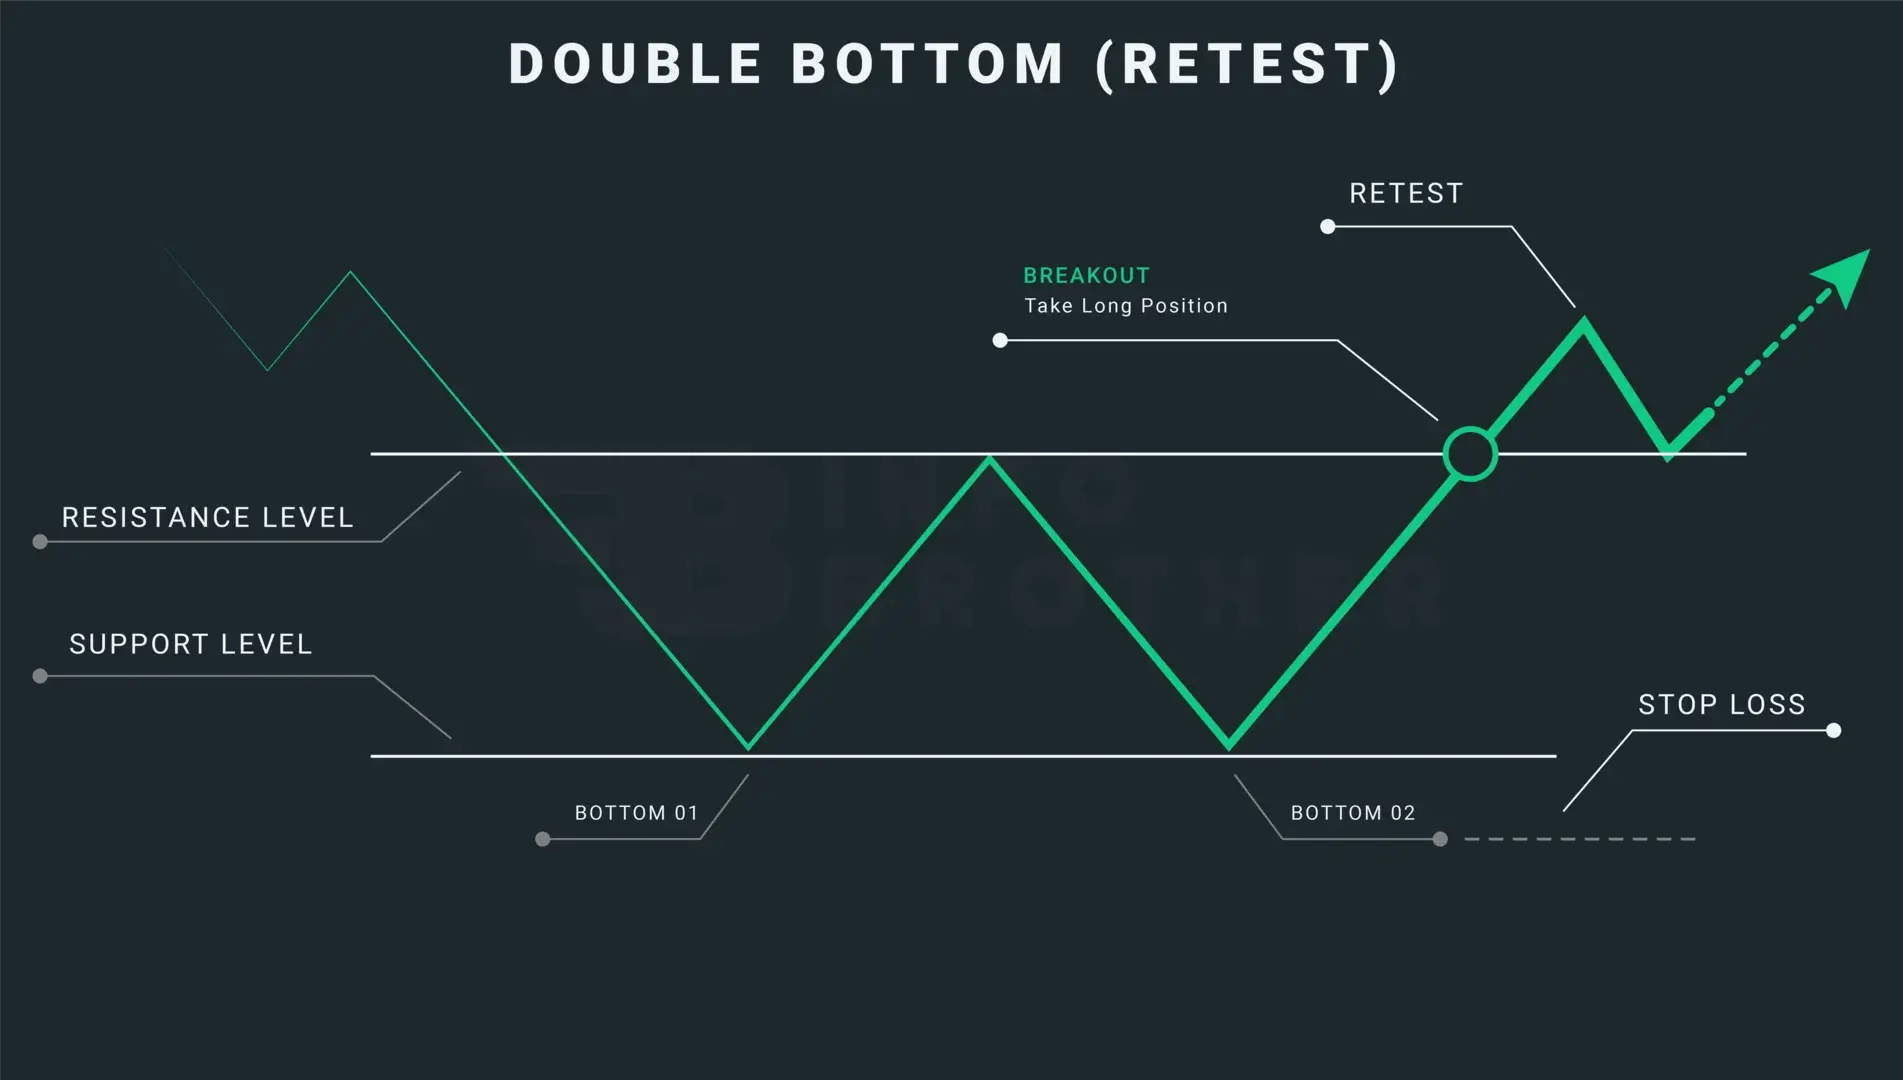
The process of the price returning to the level that the market previously broke is known as retesting. To avoid false breakouts, traders might wait for a retest, which occurs when the price breaks through the trendline and returns to retest the just passed resistance.
