The continuation chart pattern known as a "bearish pennant" frequently occurs before a price movement in the direction of the preceding trend. This pattern is visible to traders when there is a significant downward trend in the market, followed by a temporary consolidation. The pennant design resembles a little symmetrical triangle constructed of a lot of candlesticks.
Depending on the possible future price movement after the breakout from the structure, pennants can be bullish or bearish in nature.
Because they offer a good risk-reward ratio when handled correctly, pennant patterns are regarded by experienced traders as the most trustworthy chart-based trading patterns. The pennant patterns, on the other hand, are fractal in nature, which means that they may appear at all lengths of trend, from the smallest to the longest. They can also develop in any openly traded, liquid market.
The majority of traders equate flag patterns to pennant patterns. However, these two designs couldn't be more unlike one another. The appearance of the support and resistance levels inside the formations is the primary distinction between the flag pattern and the pennant pattern. Flag patterns consist of two parallel lines, whereas pennant patterns have support and resistance lines that converge towards an apex.
The pennant formation seems to be a little symmetrical triangle with convergent trendlines that enclose the price movement. Due to this pattern's high accuracy rate, traders should pay attention to it. If this pattern develops during a downward trend, there is an 84 percent likelihood that the trend will continue.
A few crucial factors to think about while attempting to identify a bearish pennant pattern are stated below.
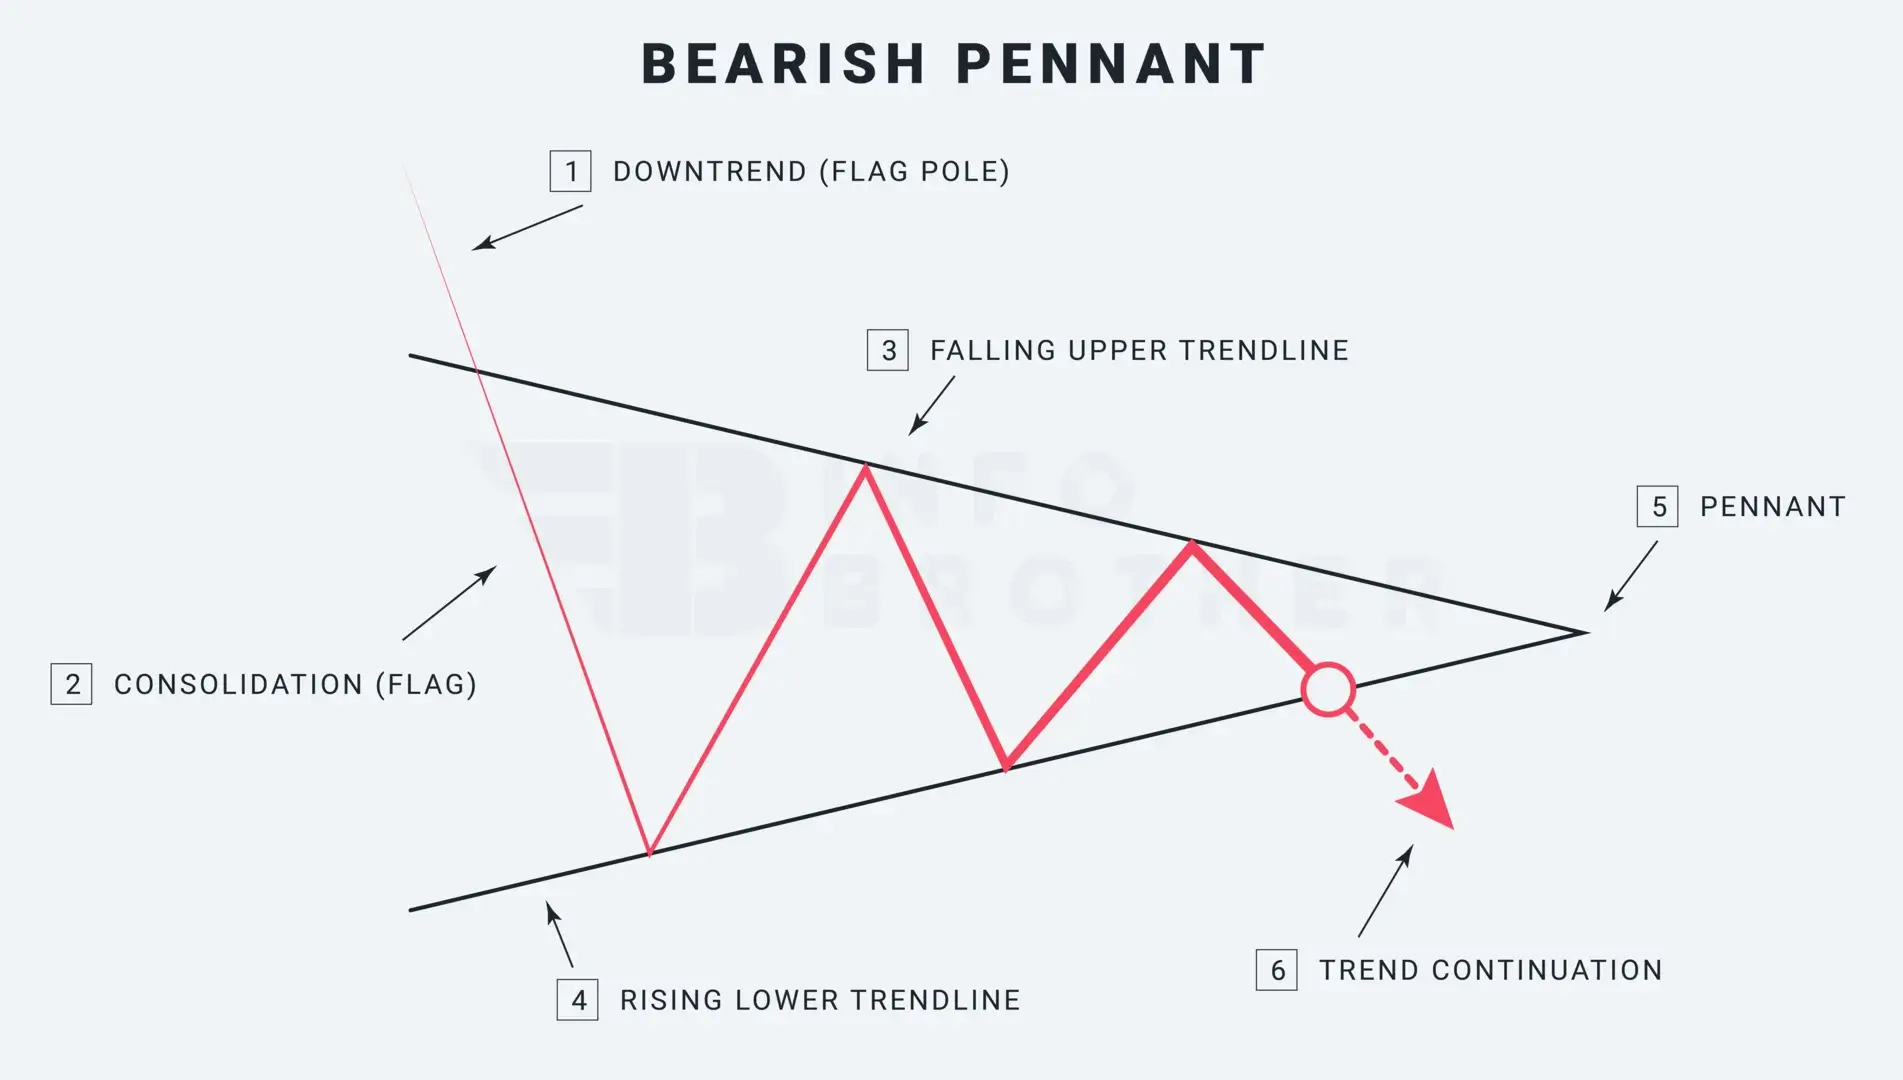
1. Downward trend (Flagpole)
The market must be in a downward trend prior to the bearish pennant pattern forming. The difference between this pattern and others like the symmetrical triangle is that this pattern always starts with a flagpole. Traders should avoid trading this pattern if the trend is upward or sideways. The symmetrical triangle is preceded by the initial strong movement, the flagpole.
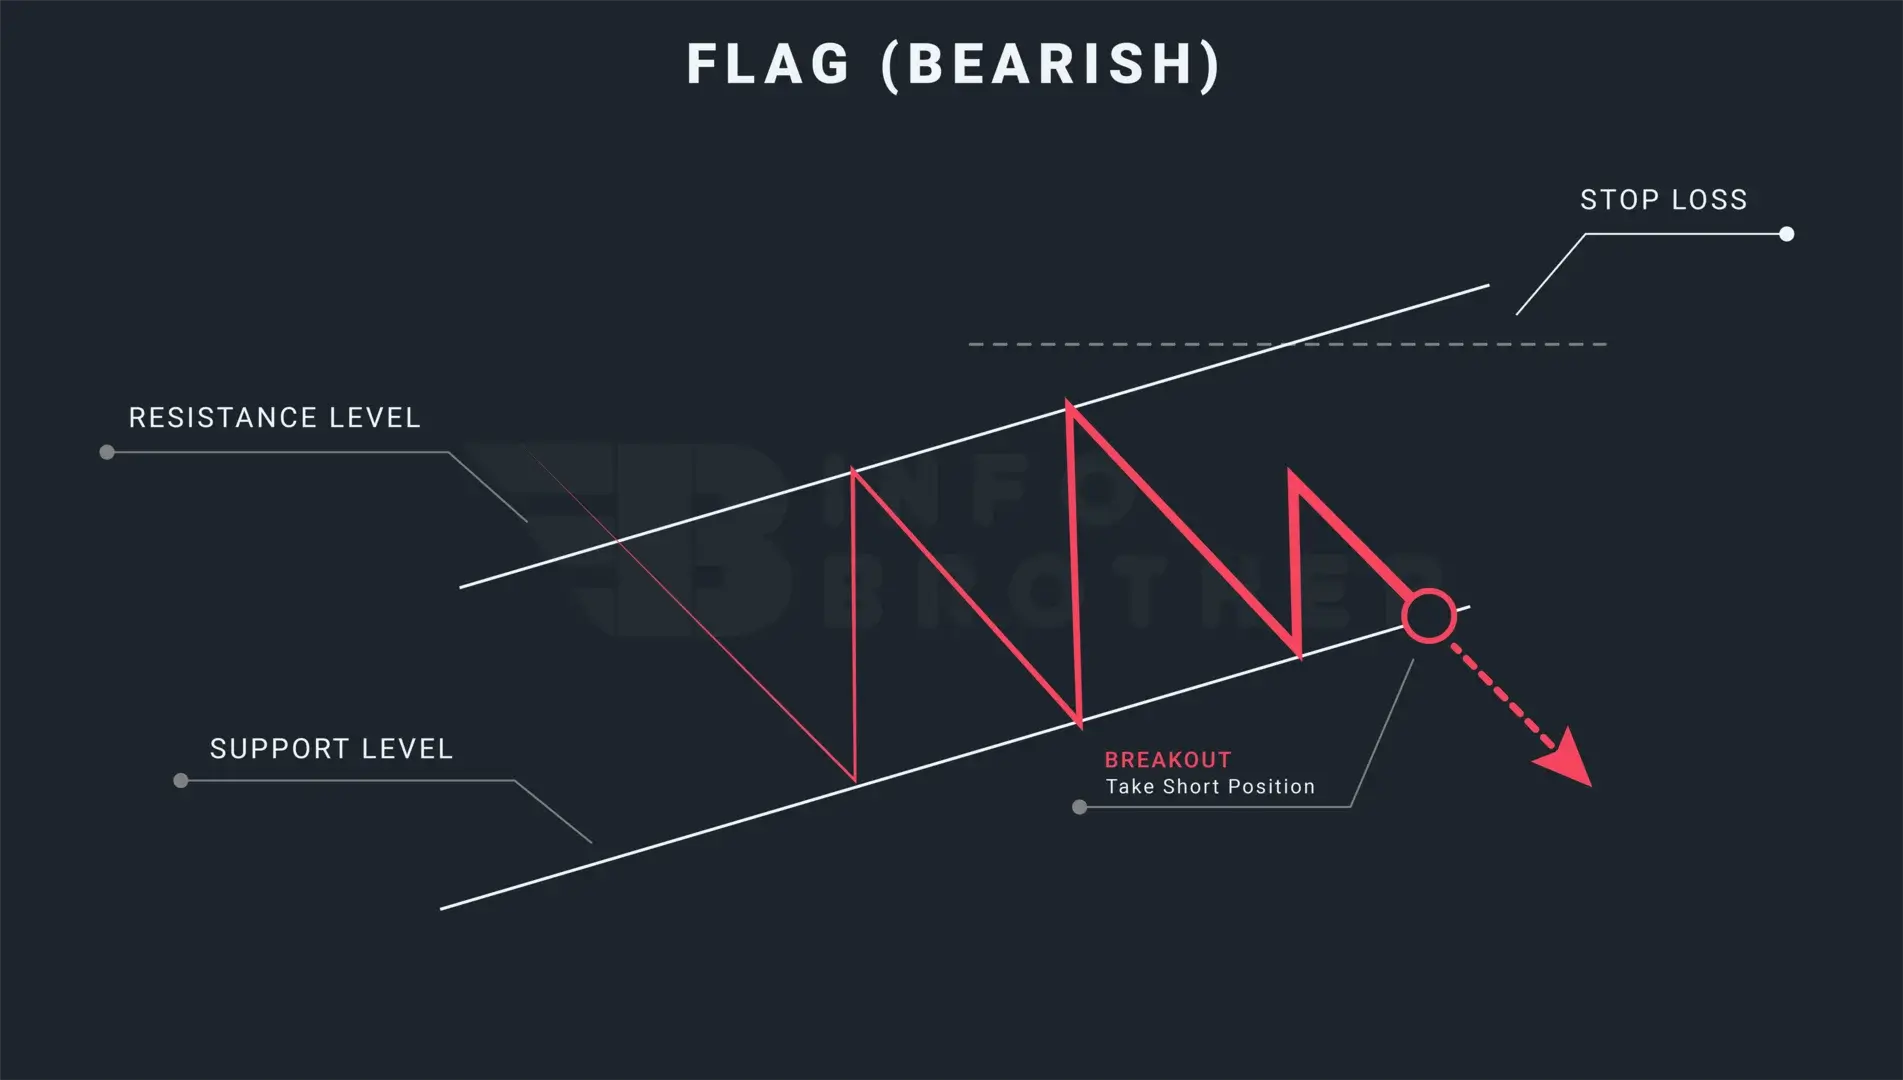
The Difference Between a Flag Pattern and a Pennant Pattern:
The look of the support and resistance levels inside the formations is the primary distinction between a flag pattern and a pennant pattern.
Read More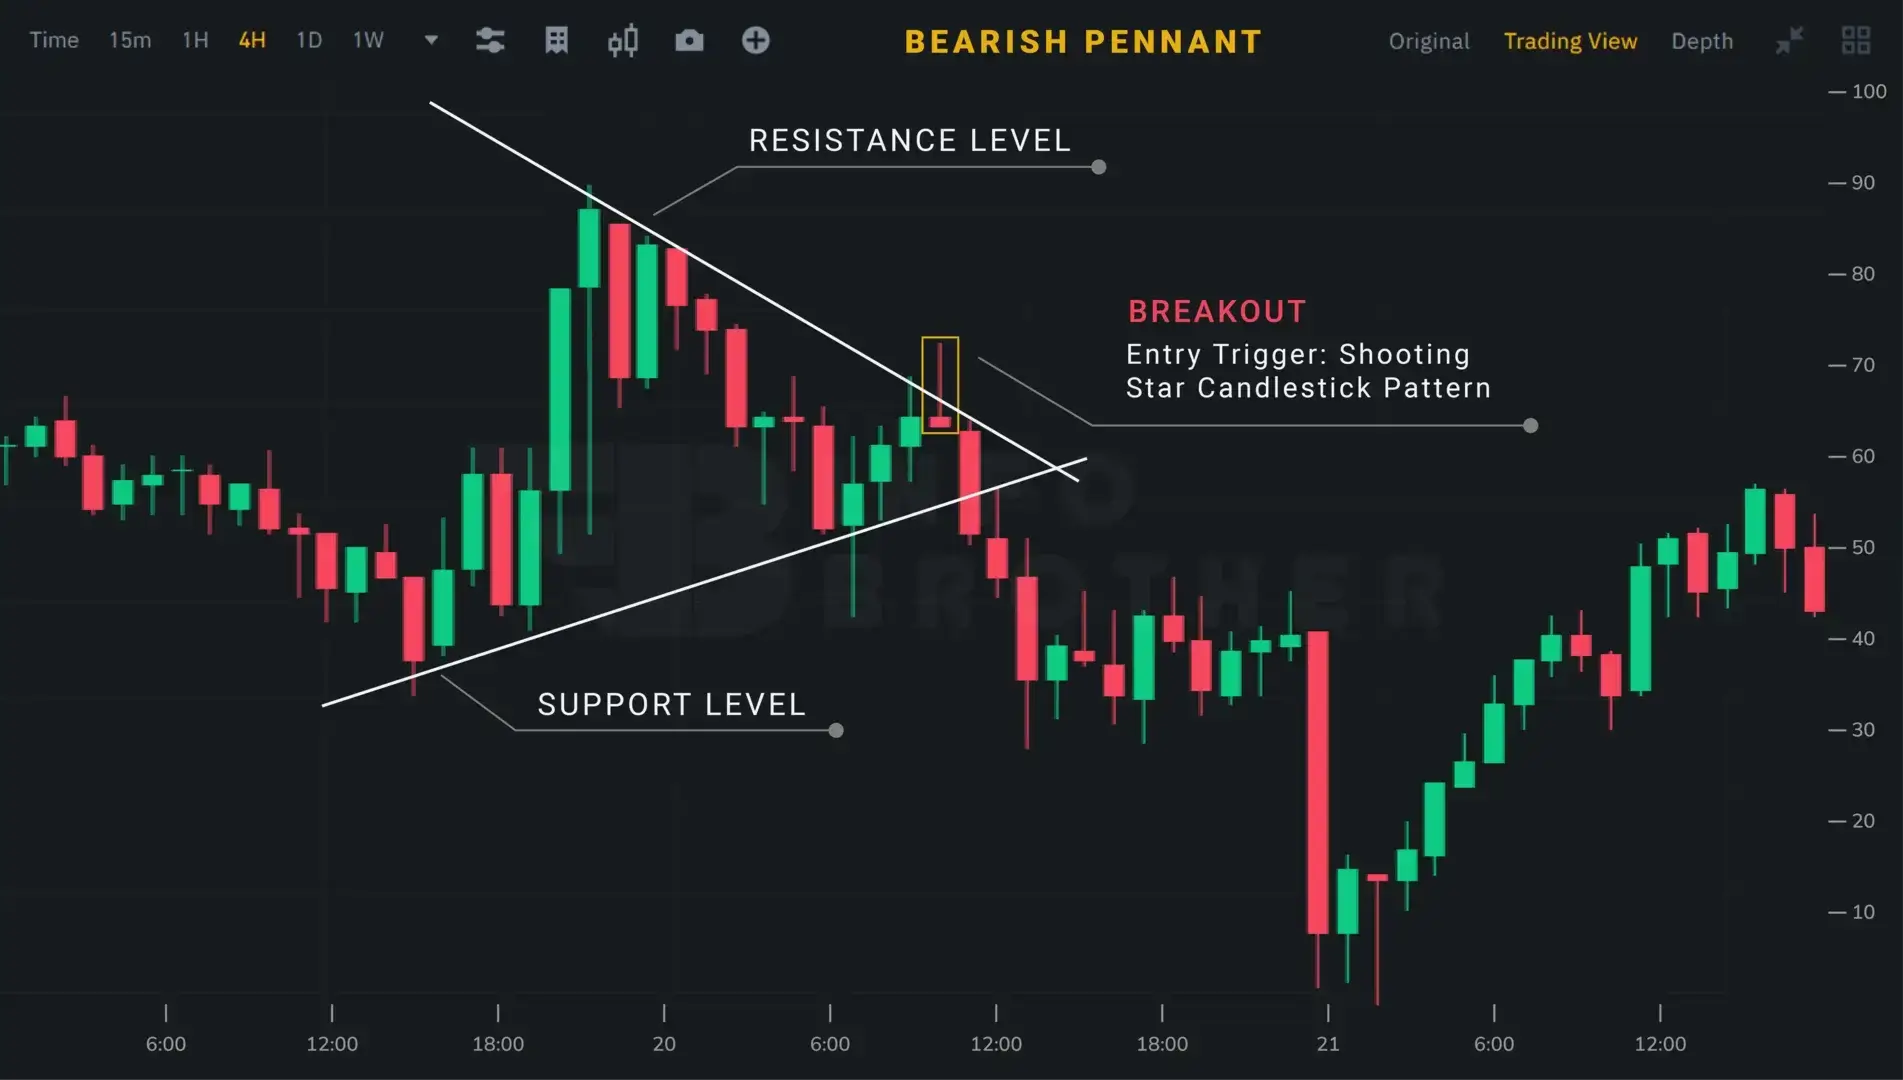
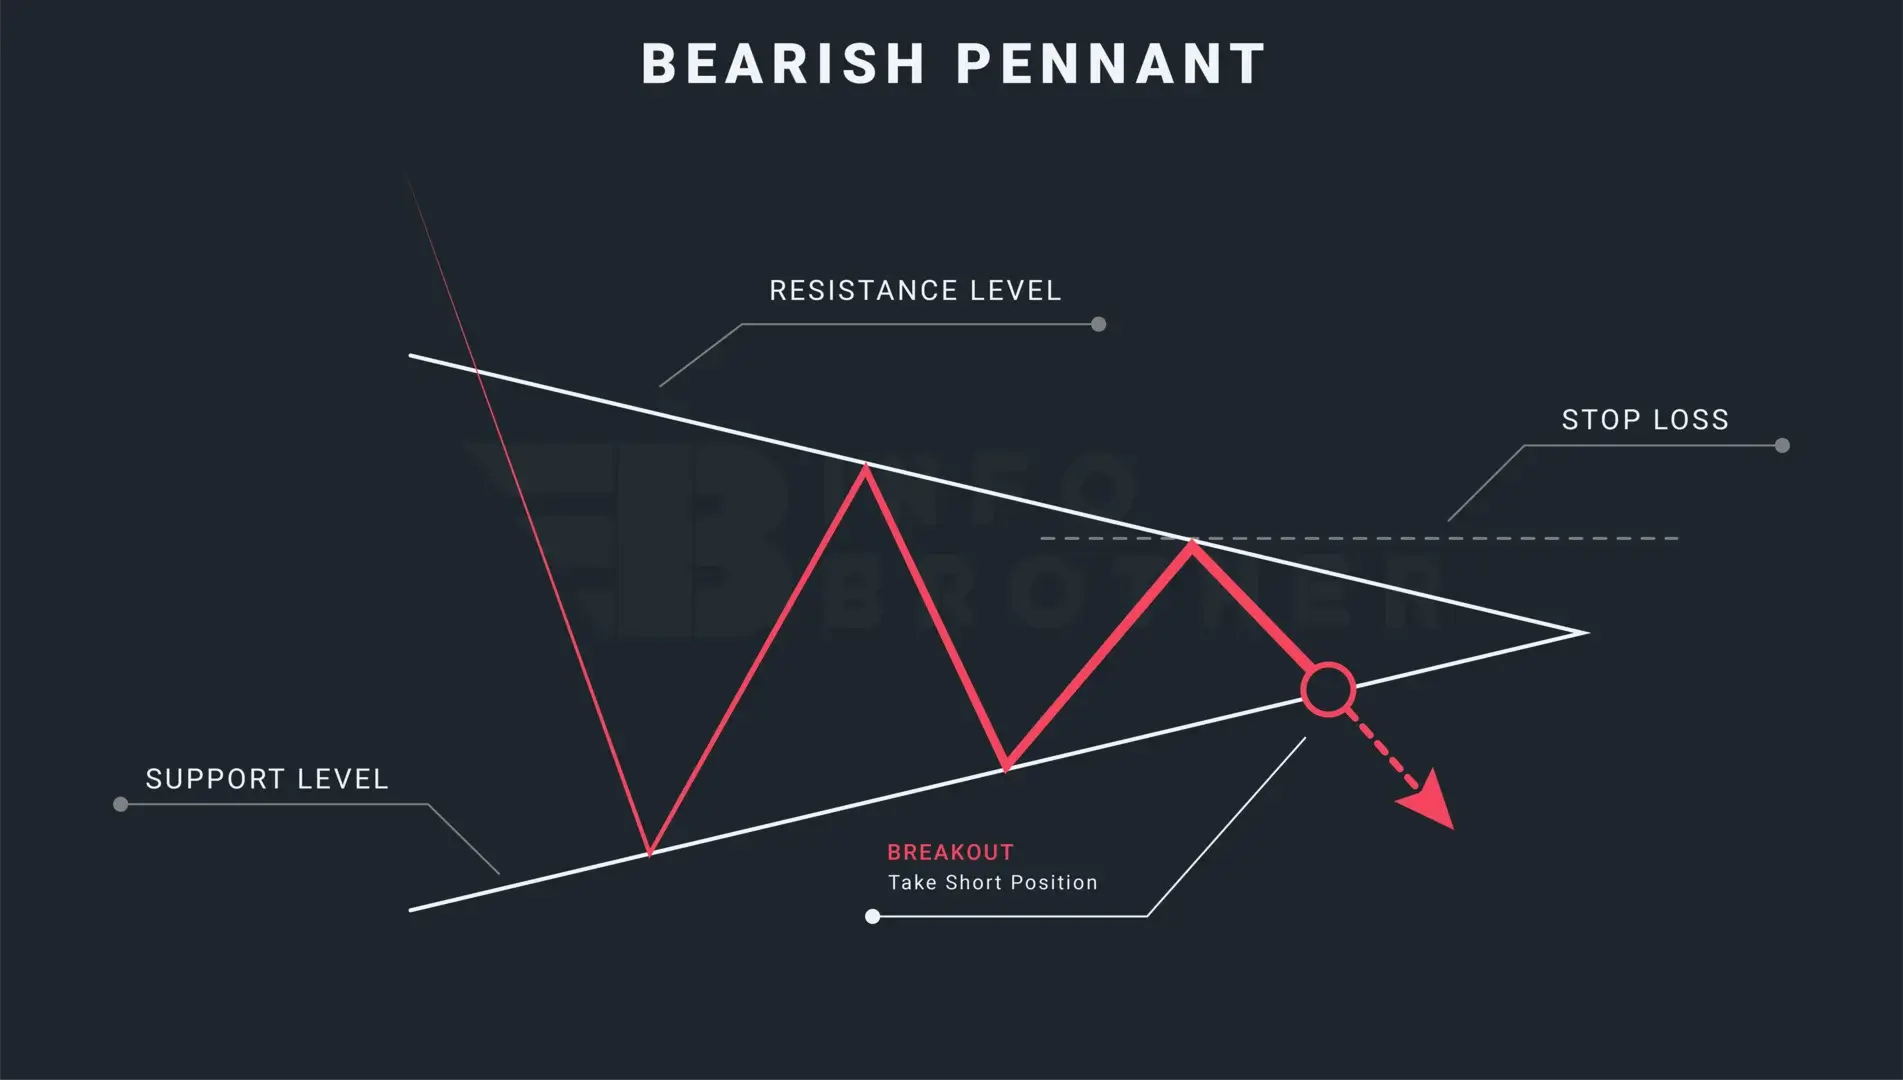
Before entering a trade following a fast and severe price change, traders should wait for the breakout. The pennant pattern predicts that after the swift price movement, there will likely be a breakout and continuation in the original move's direction.
Given that the move was rather large, a stop-loss can be set at the high of the breakout candle; alternatively, for traders who are more cautious, a stop-loss can be set above the pennant to reduce downside risk. This often provides traders with an adequate amount of protection.
Keep in mind that market movements aren't always what we anticipate, so risk management strategies should always be implemented before entering a trade.
False breakouts might be a major problem with these patterns. Price may veer from the pattern just to re-enter it, or it may even break out in the other direction. Waiting for the retest will help a trader avoid this.
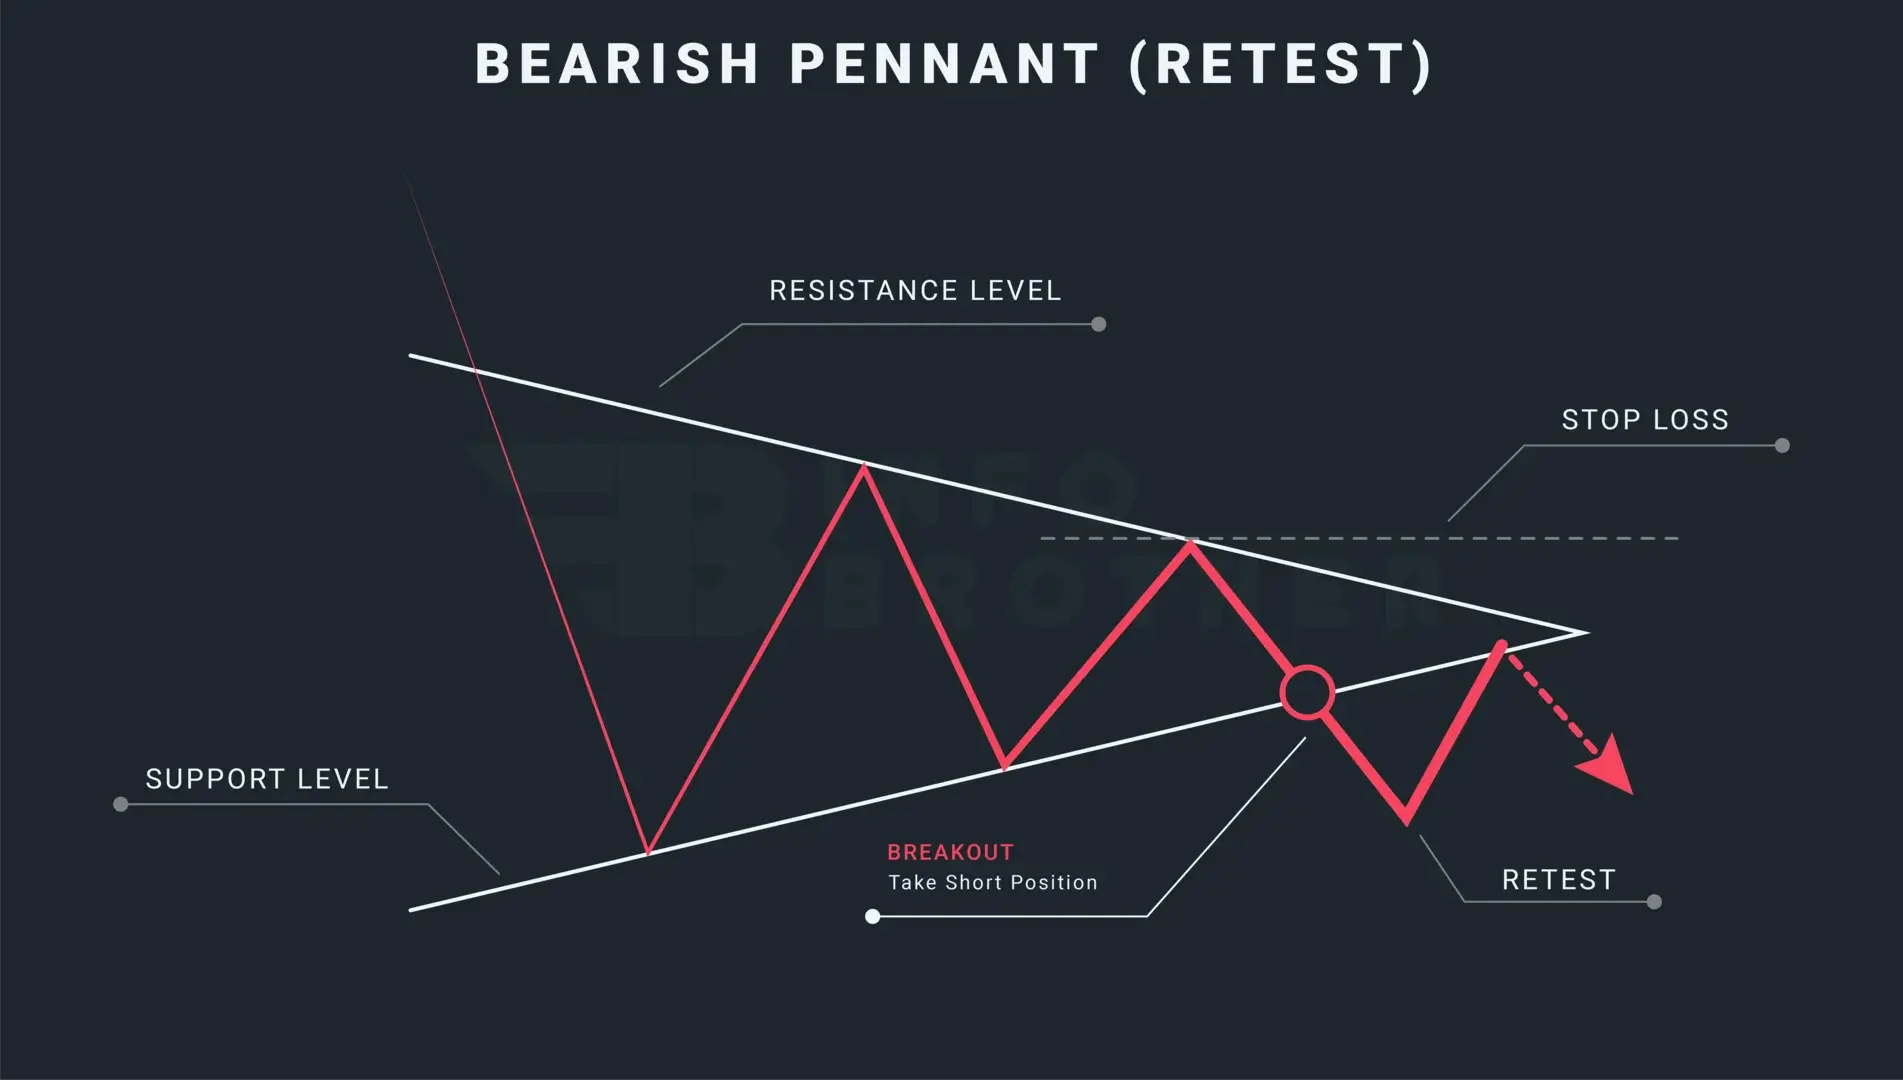
The process of the price returning to the level that the market previously broke is known as retesting. To avoid false breakouts, traders might wait for a retest, which occurs when the price breaks through the trendline and returns to retest the just passed resistance.
