Reading a Stock Ticker: Understanding Market Quotes Stock Tickers Decoded: How to Read Market Prices

Key Takeaways
Welcome to your introduction to stocks!In this lesson, we'll simplify stock quotes, making sure beginners understand the basics. Get ready to decode the ticker tape like an expert!
Contrary to popular belief, ticker tapes don't predict future prices; they present current market data. These real-time updates empower investors to assess the market dynamics effectively.
Ticker Symbol

Every stock possesses a unique identifier known as a ticker symbol.For instance, AAPL represents Apple, AMZN stands for Amazon, and TSLA symbolises Tesla. These symbols streamline the process of identifying and monitoring specific stocks on the ticker tape.
Current Price
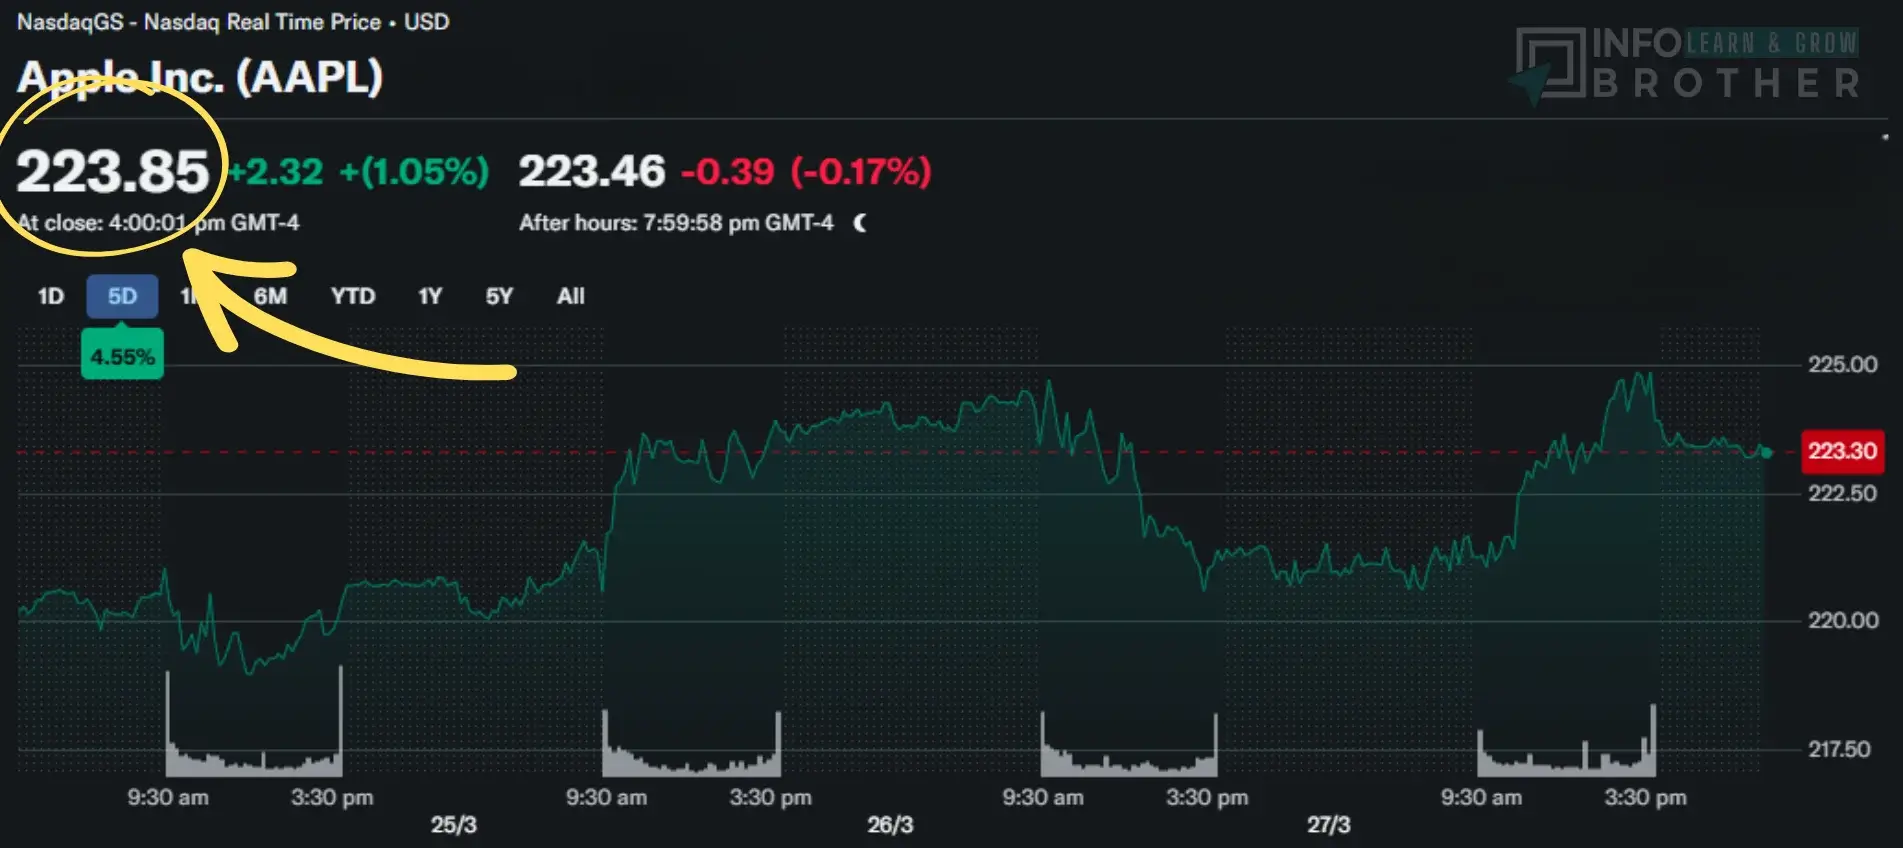
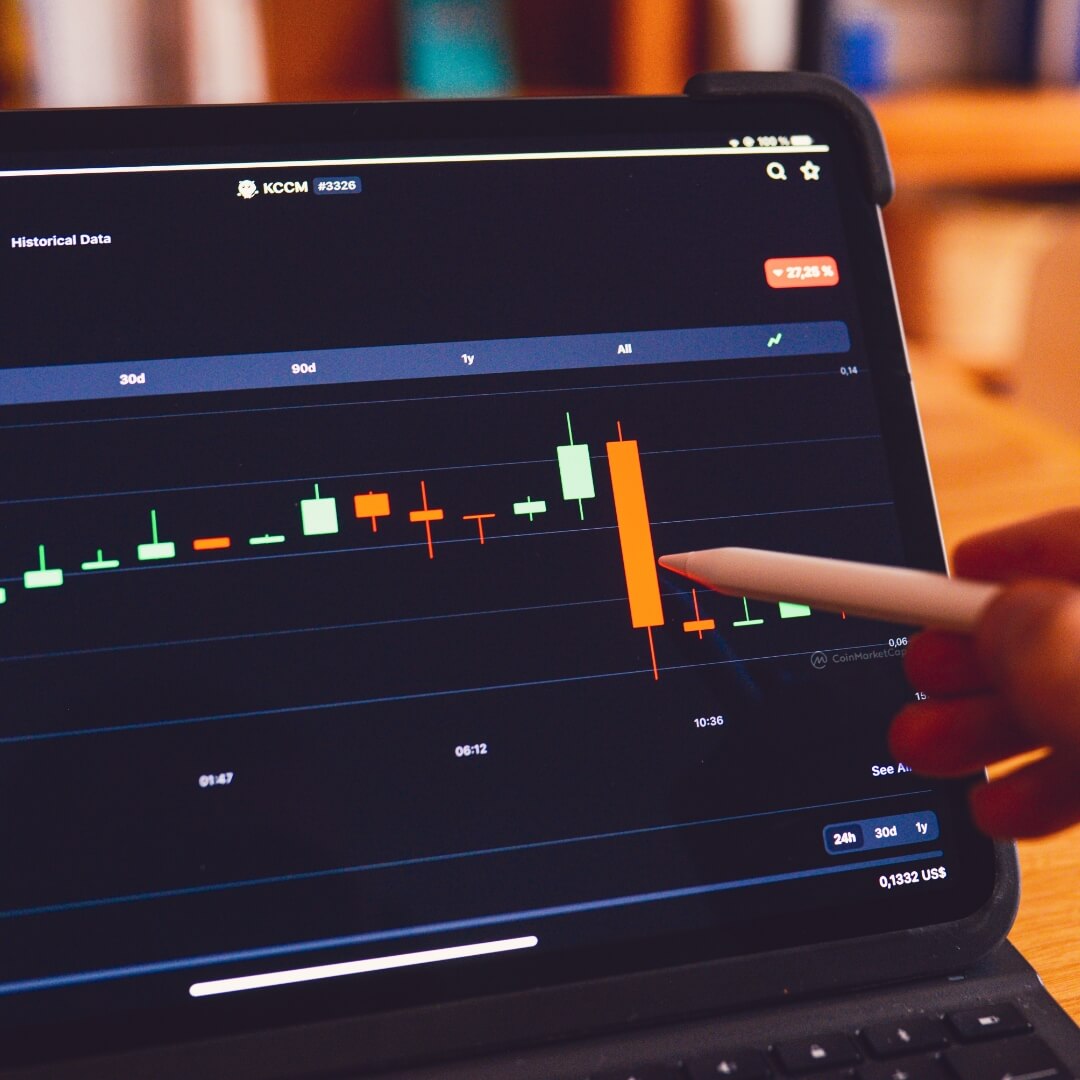
Now, let's focus on the numbers next to these symbols on the ticker tape. These numbers show the current trading price of the stock, changing in real-time throughout the trading day as transactions happen in the market. It's like seeing the heartbeat of the stock's value, reacting to the ups and downs of market forces.
Stock price movements are driven by the basic principle of supply and demand. When there's more demand than supply for a stock, prices rise as buyers compete for limited shares. On the flip side, if there's an oversupply of shares compared to demand, prices drop. Understanding these dynamics is crucial for making sense of changes in stock prices.
Price Changes
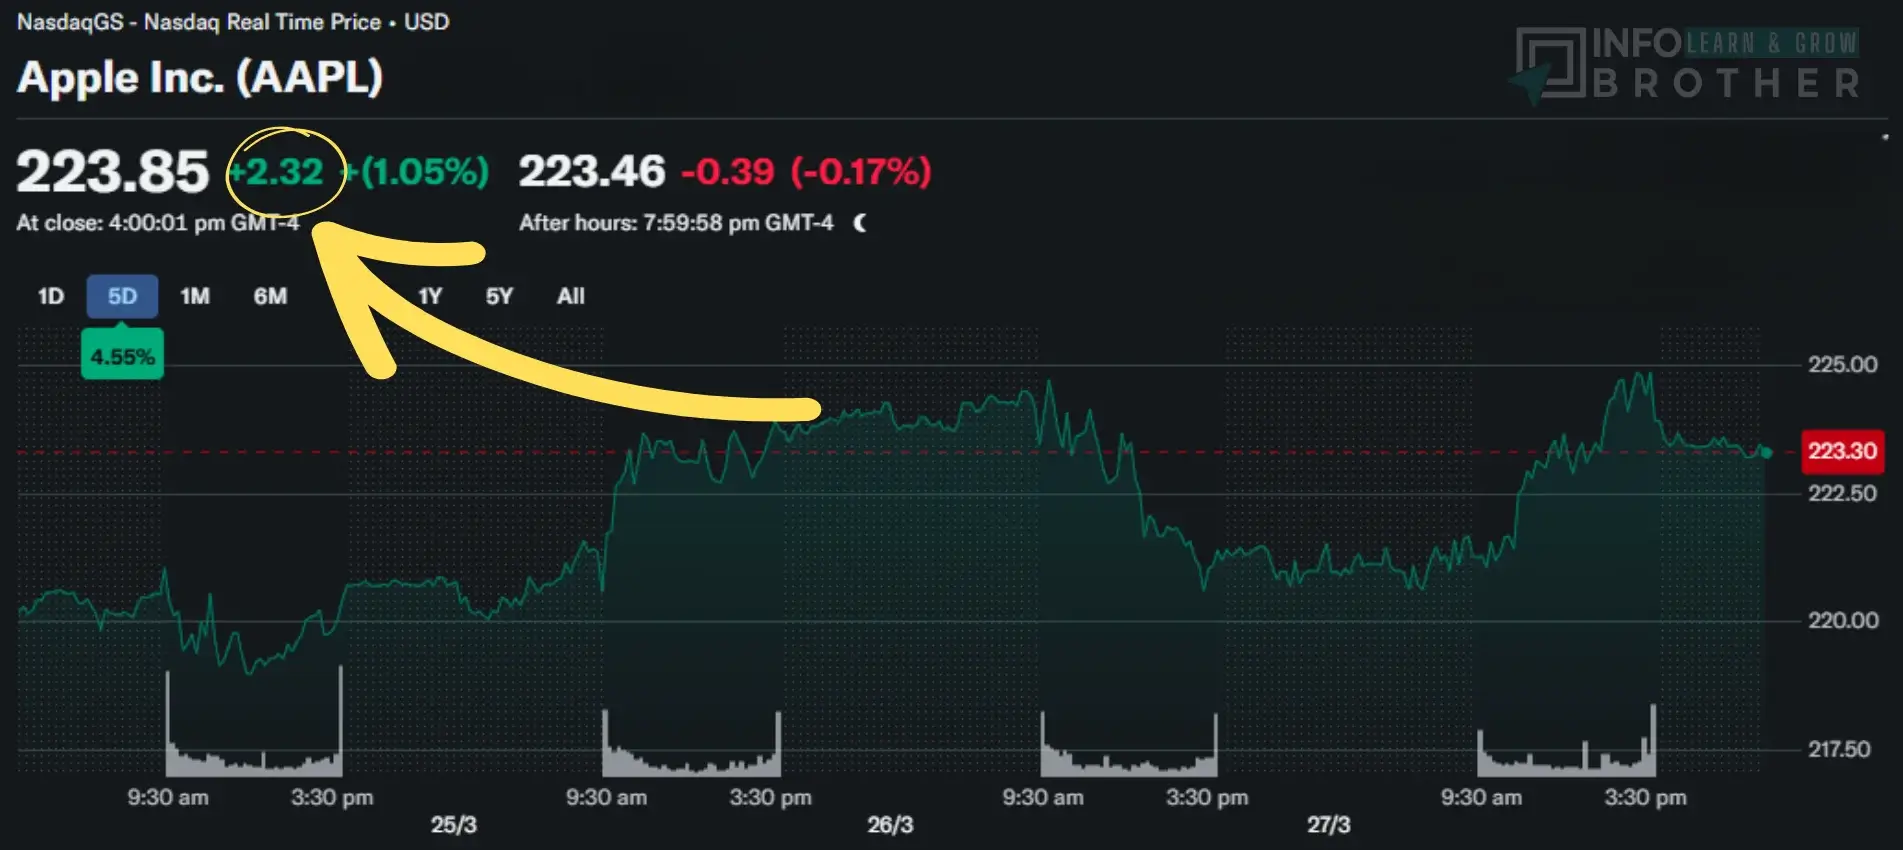
Alongside the current price, the ticker tape shows the price change from the previous day's close. This metric, called the price change, gives investors important details about the stock's performance over a set time. Positive changes show upward momentum, while negative changes signal a decrease in the stock's value.
To illustrate this concept further, let's consider a practical example:
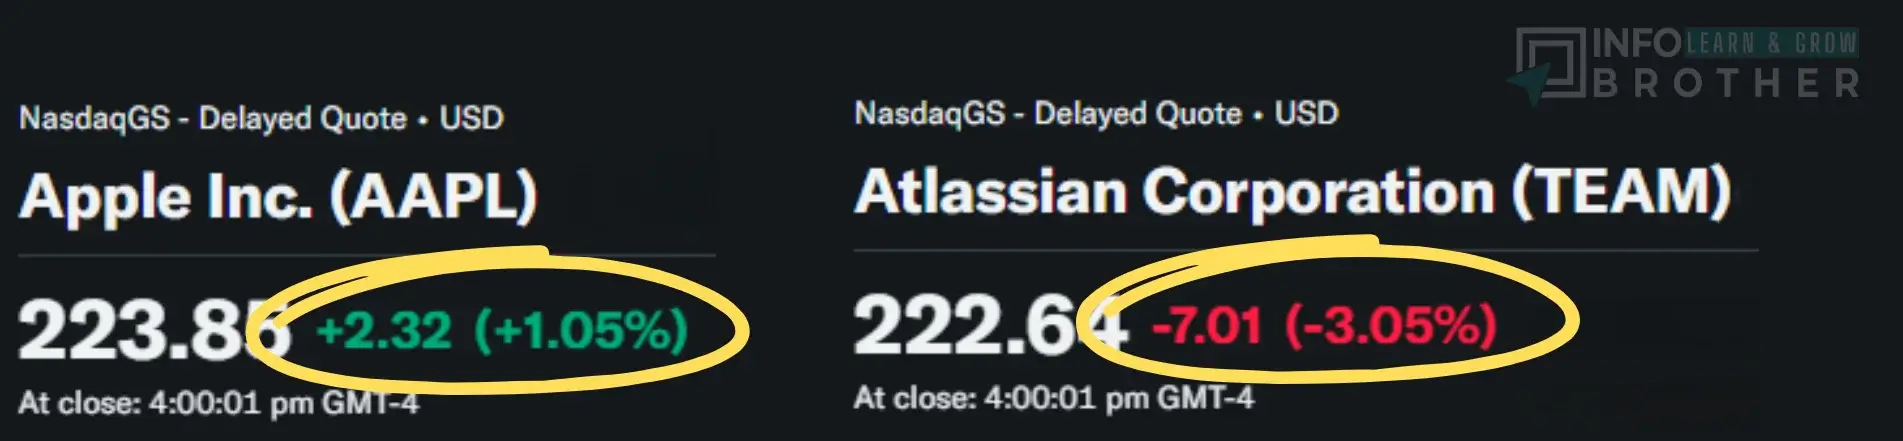
Suppose AAPL concluded trading at $221.53 yesterday. Today, it's valued at $223.85, indicating a $2.32 (+1.05%) increase from the previous day's closing price. Such price movements serve as indicators of investor sentiment and market momentum.
Stock Volume
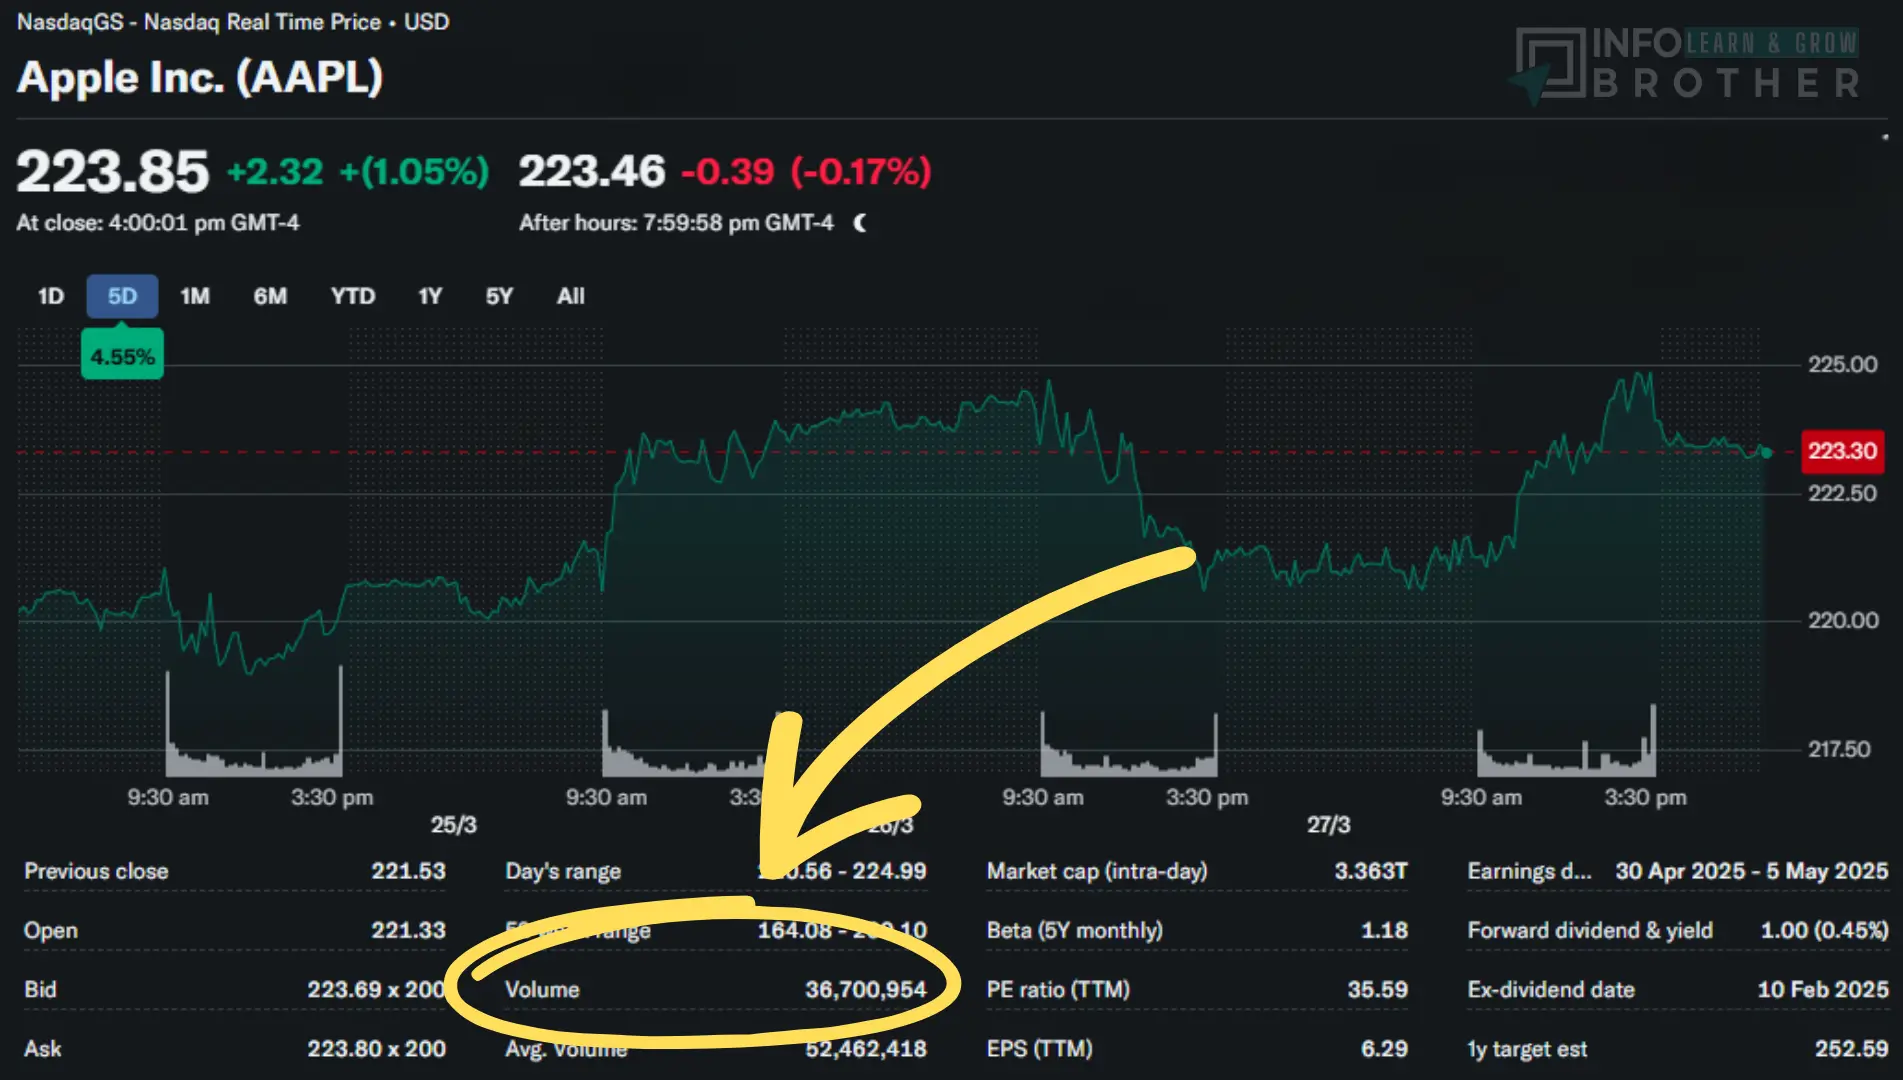
Stock volume, which shows the total number of shares traded, is another key factor to keep in mind. High trading volume often suggests increased interest or activity in a specific stock, which can affect its price direction. When there's high volume alongside price movements, it may indicate significant shifts in market sentiment or emerging trends.
Line Chart
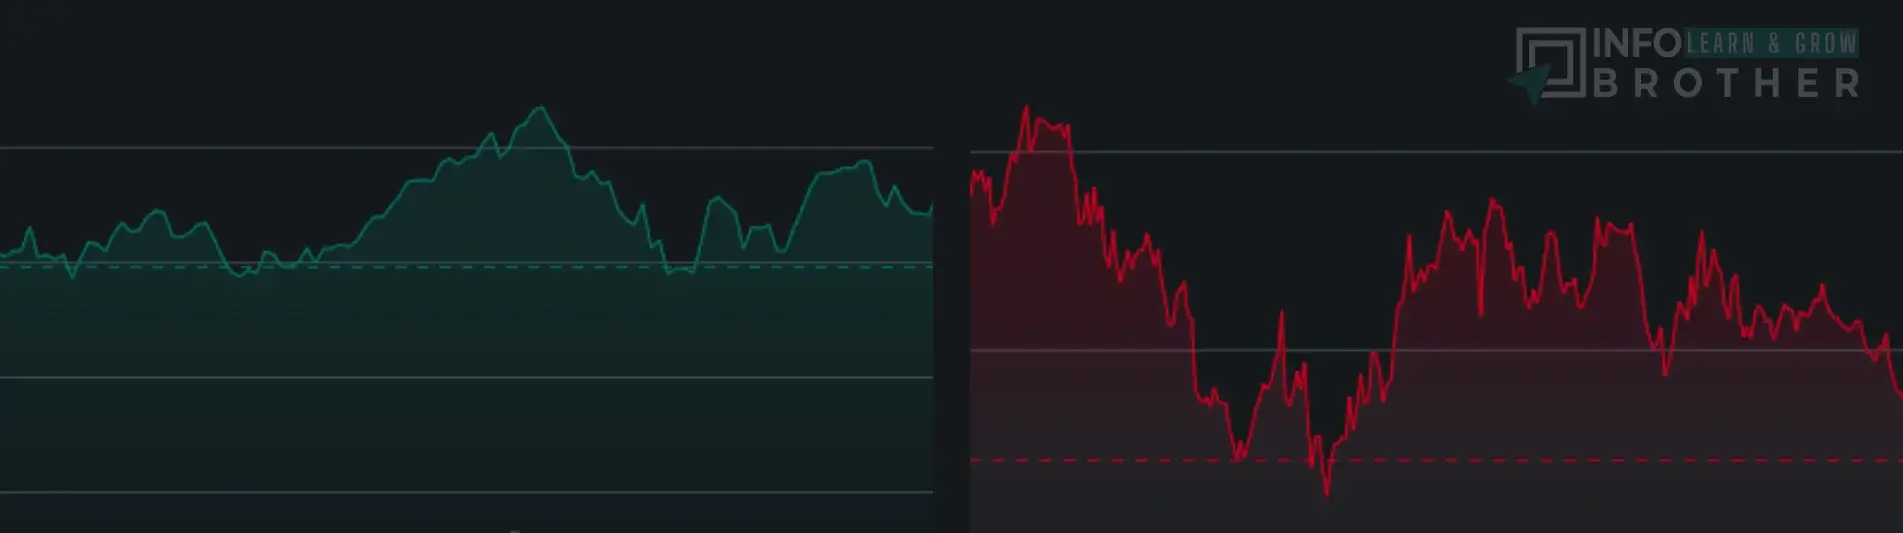
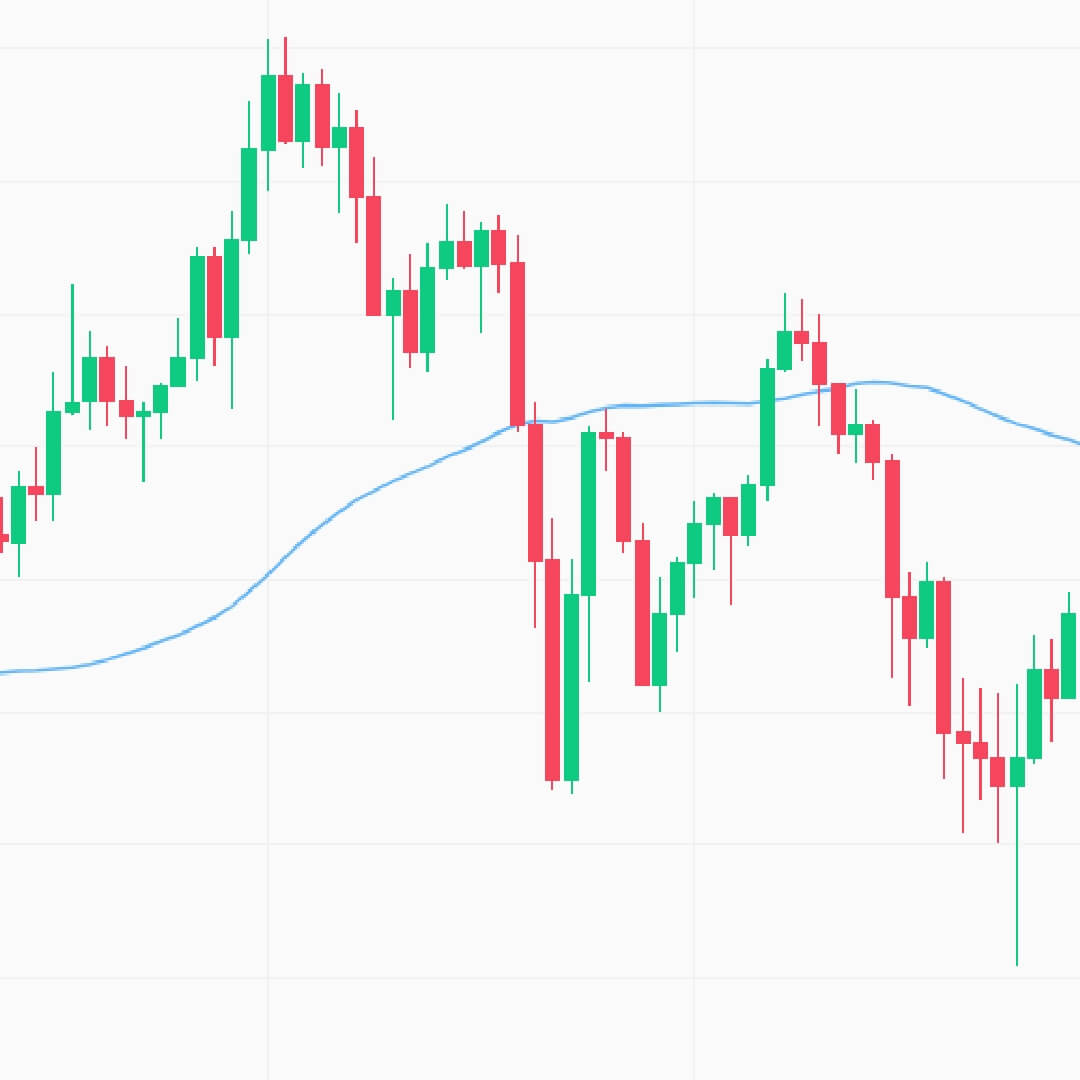
Sometimes, you'll see colour-coded highlights (Line charts) on the ticker tape. Green shows a price increase from the previous close, while red indicates a decrease. These visual cues offer a quick way to understand market sentiment, giving insights into investor sentiment and trends at a glance.
Price Change Indicators
Now, let's decode those mysterious +and -symbols, known as Price Change Indicators. These symbols simply show the direction of price changes compared to the previous close, with +meaning an increase and -signaling a decrease. Understanding these basic indicators helps investors swiftly evaluate stock performance and make informed decisions.
How can investors use this information?
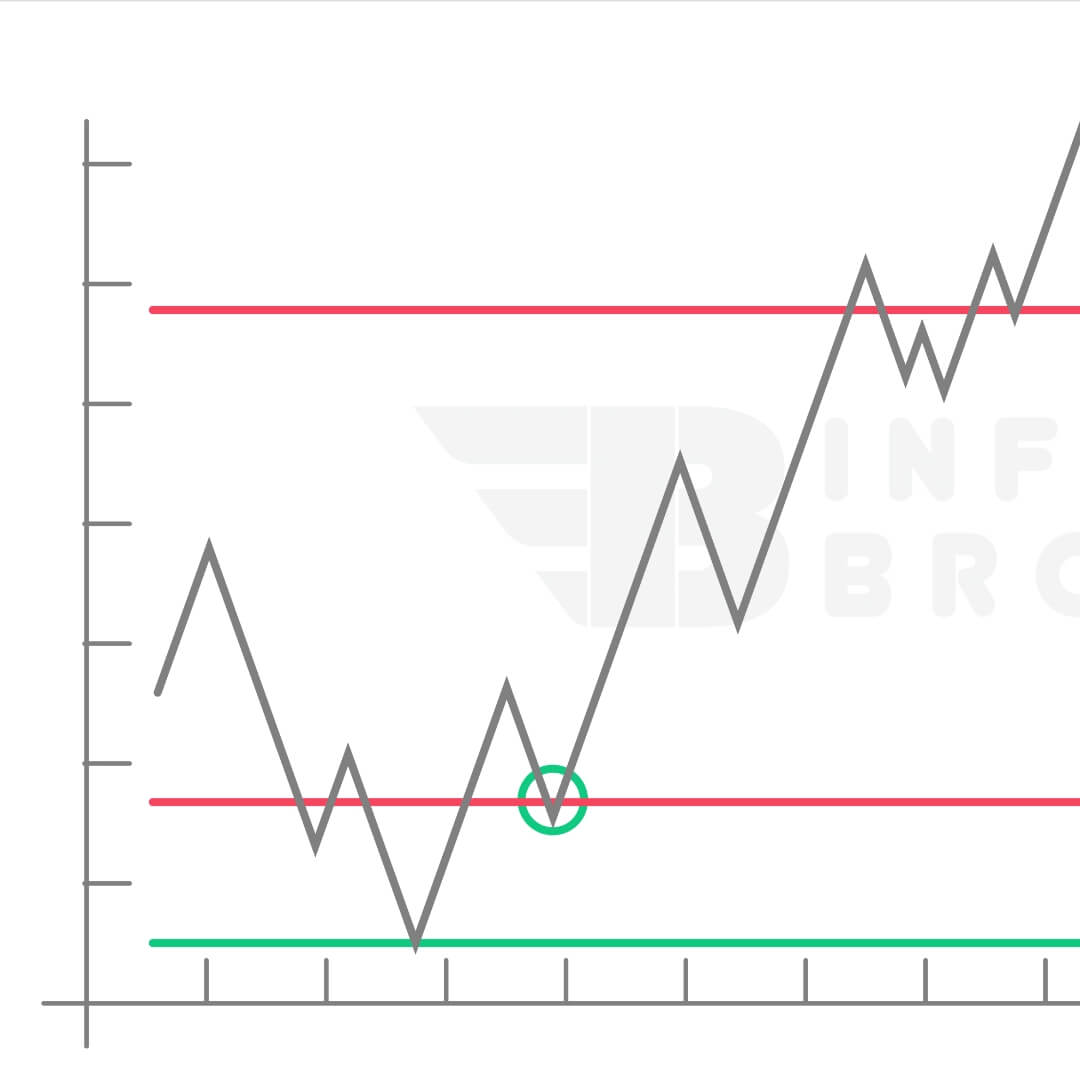
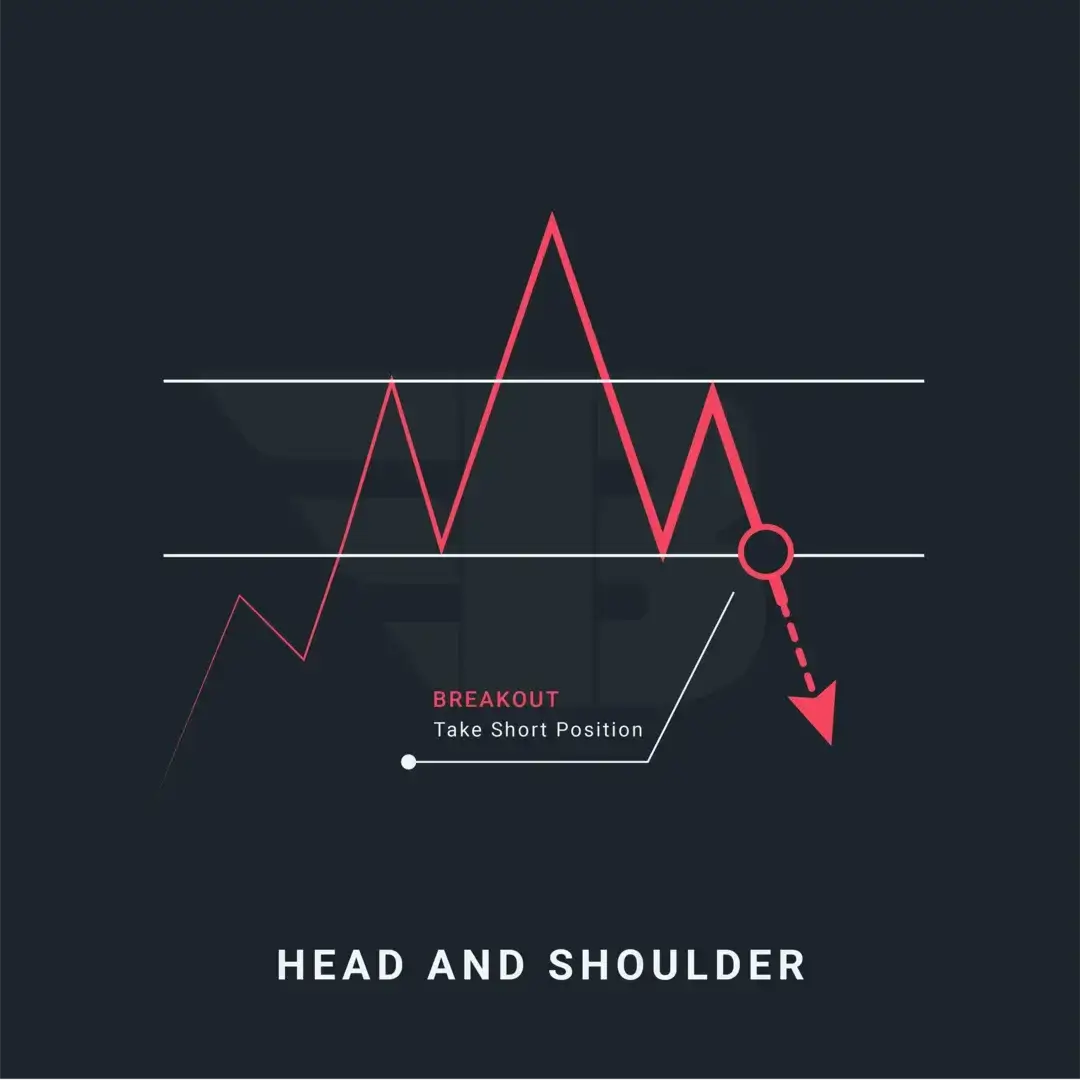
Investors can harness this wealth of information by recognising patterns and trends on the ticker tape. This allows them to spot potential opportunities or risks, empowering them to make informed decisions about buying, selling, or holding stocks. Analysing trends in stock prices, volumes, and price changes provides valuable insights into market sentiment and potential future movements.
For example, if you consistently see green highlights with significant trading volume, it could indicate a strong, positive trend. This information could influence investment decisions.
However, It's important to understand that stock prices are influenced by various factors, such as company performance, economic indicators, geopolitical events, and investor sentiment. Staying updated on relevant news and developments is essential for making informed investment decisions in a dynamic and constantly evolving market.
Congratulations! You've mastered the basics of reading a ticker tape, giving yourself the tools to confidently navigate the complexities of the stock market. Use this knowledge to monitor stocks, understand market trends, and make informed investment choices